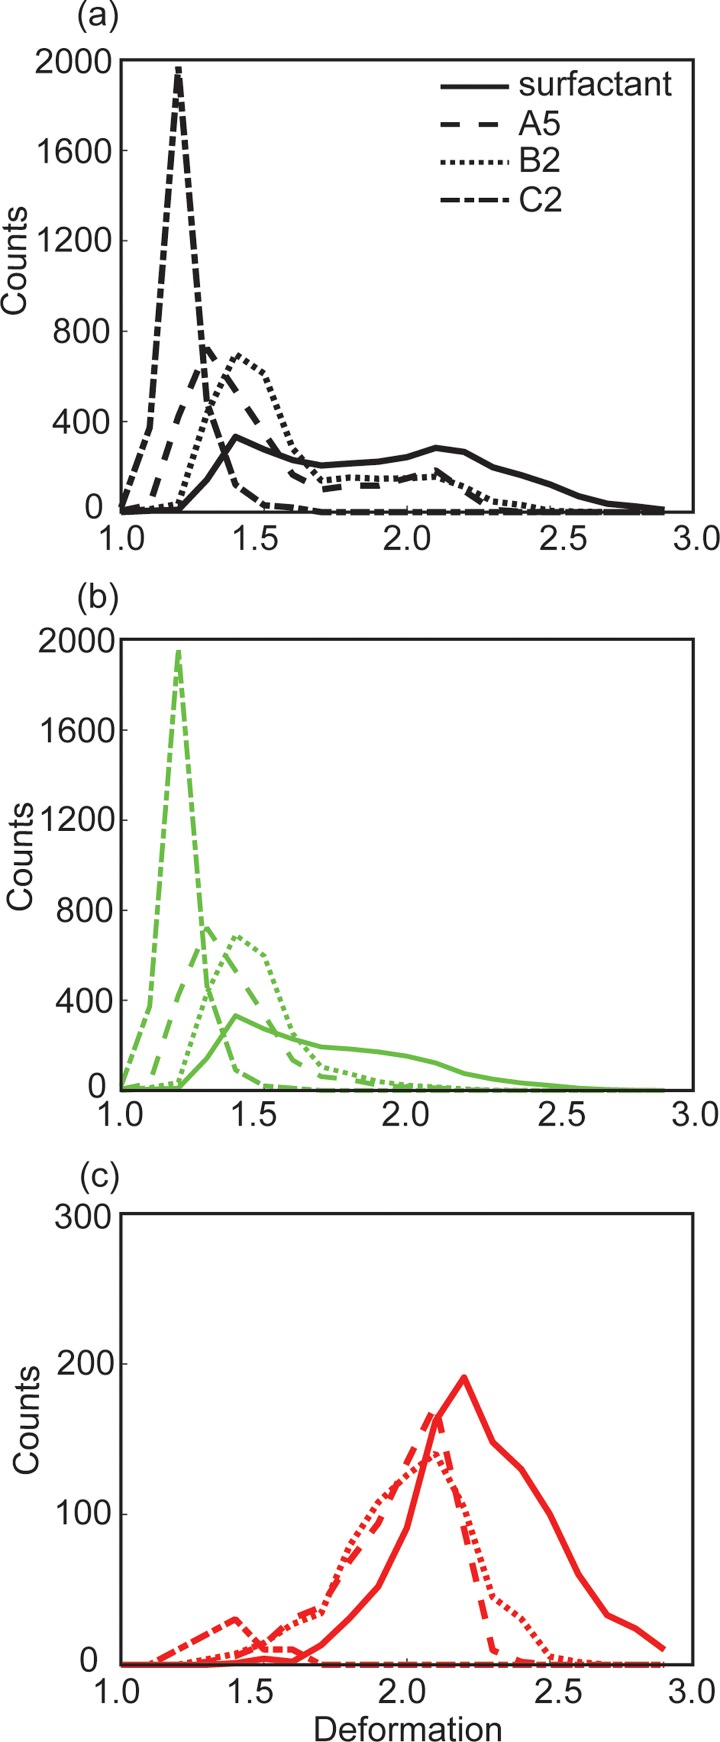
FIG. 6.
(a) Distribution of the maximum deformation of 3000 drops, including both break-up and non-breakup drops. (b) The same distribution as that in (a), but for non-breakup drops only. (c) The same distribution as that in (a), but for break-up drops only. The curves in (a)–(c) correspond to datasets shown in Figs. 5(i)–5(l), respectively.

