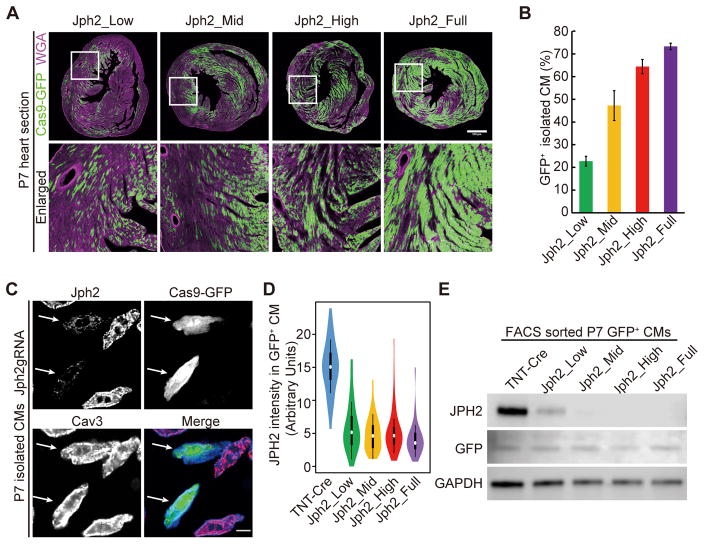
Figure 3. Effect of AAV dosage on the frequency of cardiac myocyte transduction and the extent of JPH2 depletion.
(A) Representative images of GFP+ CMs in P7 heart sections that were infected with different doses of AAVs. Scale bar, 500 μm. Boxed area were enlarged at bottom. (B) Quantification of the fraction of GFP+ CMs that were isolated from P7 hearts infected with different doses of AAVs. n = 3 hearts. >400 CMs were counted per heart. (C) Immunostaining of JPH2 in CMs isolated from P7 hearts. Arrows point to GFP+ CMs that were depleted of JPH2. Scale bar, 10 μm. (D) Violin plots of JPH2 immunofluorescence intensity in maximally projected confocal images of P7 CMs. For each group, n = 60 CMs isolated from 3 hearts. White circles and boxes indicate medians and 25th and 75th percentiles. Whiskers extend 1.5 times the interquartile range from the 25th and 75th percentiles. Colored shapes show density estimates of the data. (E). Immunoblot showing level of JPH2 protein GFP+ CMs from the indicated treatment groups.

