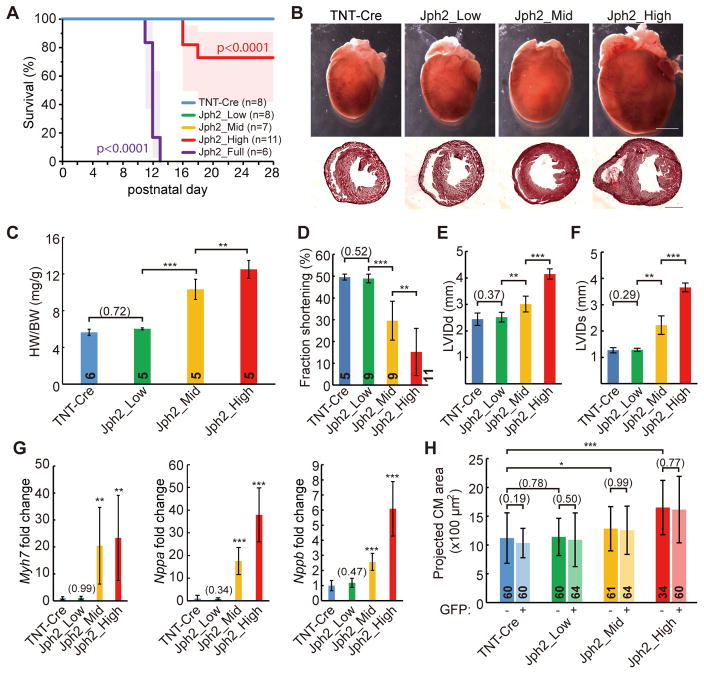
Figure 4. Dose-dependent induction of myocardial dysfunction by AAV-gRNA(Jph2).
(A) Kaplan-Meier analysis of survival curve under control or different doses of Jph2gRNA AAV treatments. (B) Representative whole-heart brightfield images (above) and H&E-stained frozen cross sections (bottom). Scale bar, 2 mm. (C) Heart weight (HW)-body weight (BW) ratio at P21. (D–F) Echocardiographic analysis of heart size and function in P21 mice treated with indicated doses of Jph2gRNA AAV. LVIDd, left ventricular internal diameter end diastole; LVIDs, left ventricular internal diameter end systole. (G) qRT-PCR measurement of heart stress markers. mRNA extracted from P21–P24 heart apexes were analyzed. n=6 hearts. (H) Cell size analysis of isolated CMs. CMs were isolated from 3 hearts in each group. Student’s t-test: *p<0.05; **p<0.01; ***p<0.001. Non-significant p values are shown in parentheses. Numbers in bars indicate sample size. Plots show mean ± SD.

