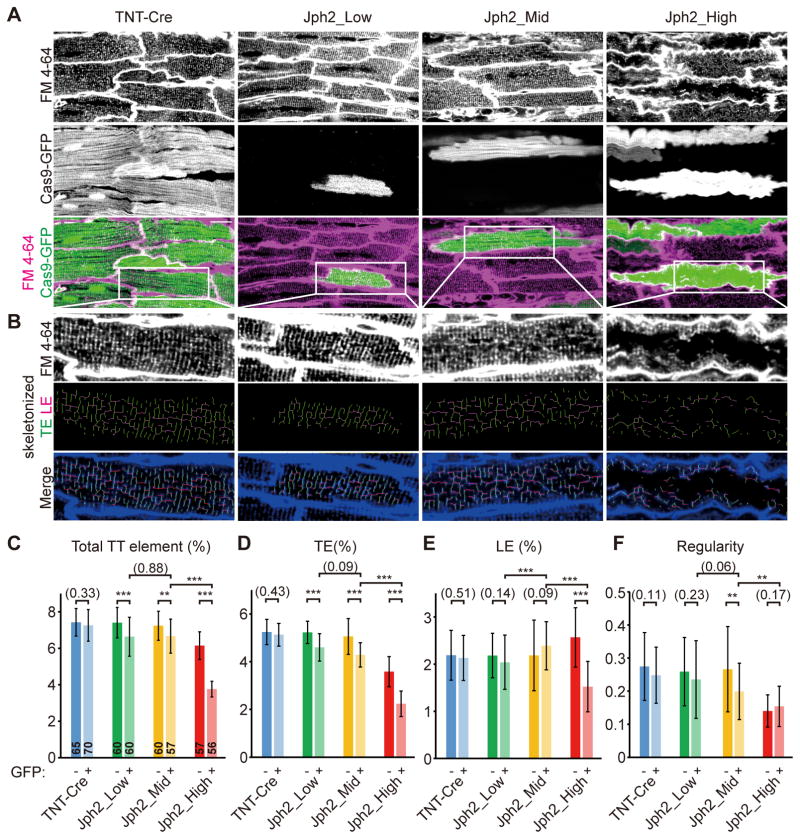
Figure 5. In situ T-tubule analysis of cardiac myocytes with mosaic JPH2 depletion.
(A) In situ confocal live imaging of T-tubules in FM4-64-loaded P21 hearts under control or mosaic JPH2 depletion. Scale bar, 20 μm. (B) T-tubule patterns in white boxes in (A) were enlarged and skeletonized. (C–F) AutoTT quantification of T-tubule patterns under in situ imaging. TE, transverse element; LE, longitudinal element; Total TT element=TE+LE. Number of CMs analyzed is shown in columns in panel (C). CMs were dissociated from 3 hearts. Student’s t-test: **p<0.01; ***p<0.001. Non-significant p values are shown in parentheses. Plots show mean ± SD.

