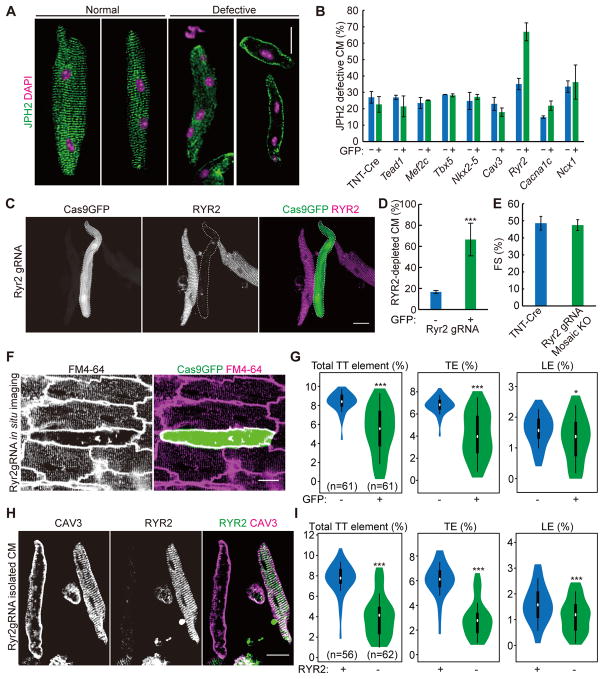
Figure 8. CASAAV-based genetic screen identifies RYR2 as a novel T-tubule regulator.
(A) Representative images of JPH2 immunostaining patterns in isolated CMs that demonstrate normal and defective T-tubule organization. (B) Quantification of JPH2 patterns in isolated P21 CMs in which 8 candidate genes were individually and mosaically targeted. >50 CMs were counted per heart. n=3 hearts. (C) Immunostaining of RYR2 demonstrates successful depletion of RYR2 in GFP+ CMs (delineated by dashed lines) that are infected by AAV-Ryr2gRNA. (D) Quantification of RYR2 knockout efficiency. >50 CMs were counted per group. n=3 hearts. (E) Fractional shortening (FS) of control and RYR2 mosaic knockout hearts. n=3. (F) in situ T-tubule image of hearts under mosaic RYR2 knockout. (G) AutoTT quantification of RYR2 mosaic knockout CMs. (H) CAV3 and RYR2 immunostaining patterns in CMs isolated from hearts under RYR2 mosaic knockout. (I) AutoTT quantification of CAV3 pattern in RYR2+ and RYR2− isolated CMs. In all images, scale bar=20 μm. Violin plots in panels G and I are as in Fig. 3D. CMs were from 3 hearts. Student’s t-test: *p<0.05; **p<0.01; ***p<0.001. Column charts show mean ± SD.

