
Figure 7.
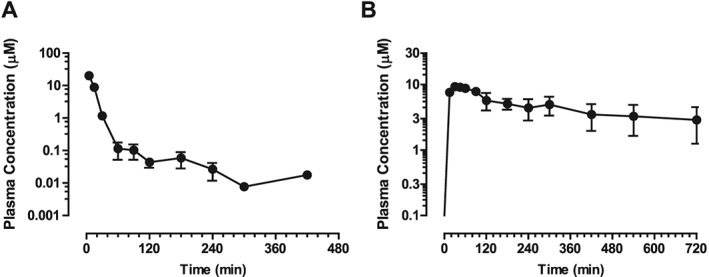
Pharmacokinetic profiles of isorhapontigenin in Sprague–Dawley rats. Rats were administered (A) 30 μmol·kg−1 isorhapontigenin i.v. or (B) 600 μmol·kg−1 isorhapontigenin p.o. Blood was collected at specific time points and plasma analysed using LC‐MS/MS. Data are presented as mean ± SEM (n = 5).