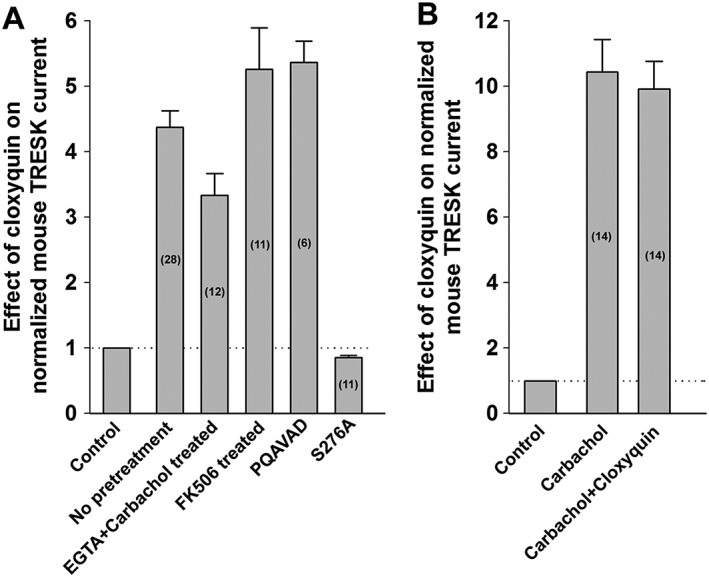
Figure 3.

Summary of the effects of different manipulations on the cloxyquin‐mediated mTRESK activation. (A) The effects of different manipulations on the cloxyquin‐mediated TRESK activation are summarized in a column graph. The number of oocytes recorded for each condition is shown in the columns. The first bar and the dotted horizontal line mark the normalized current before the application of cloxyquin. (B) The effect of carbachol (1 μM) and subsequent application of cloxyquin (100 μM) on mTRESK are summarized as a column graph. The number of oocytes recorded for each condition is shown in the columns. The first bar and the dotted horizontal line indicate the normalized current before carbachol application.
