
Figure 2.
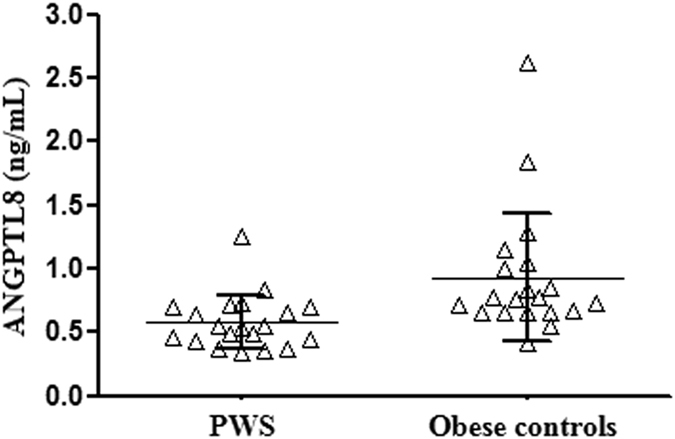
Individual values of circulating ANGPTL8 levels obtained in PWS patients and obese controls. Lines represent mean and standard deviation values in the two populations.
Official websites use .gov
A
.gov website belongs to an official
government organization in the United States.
Secure .gov websites use HTTPS
A lock (
) or https:// means you've safely
connected to the .gov website. Share sensitive
information only on official, secure websites.
Individual values of circulating ANGPTL8 levels obtained in PWS patients and obese controls. Lines represent mean and standard deviation values in the two populations.