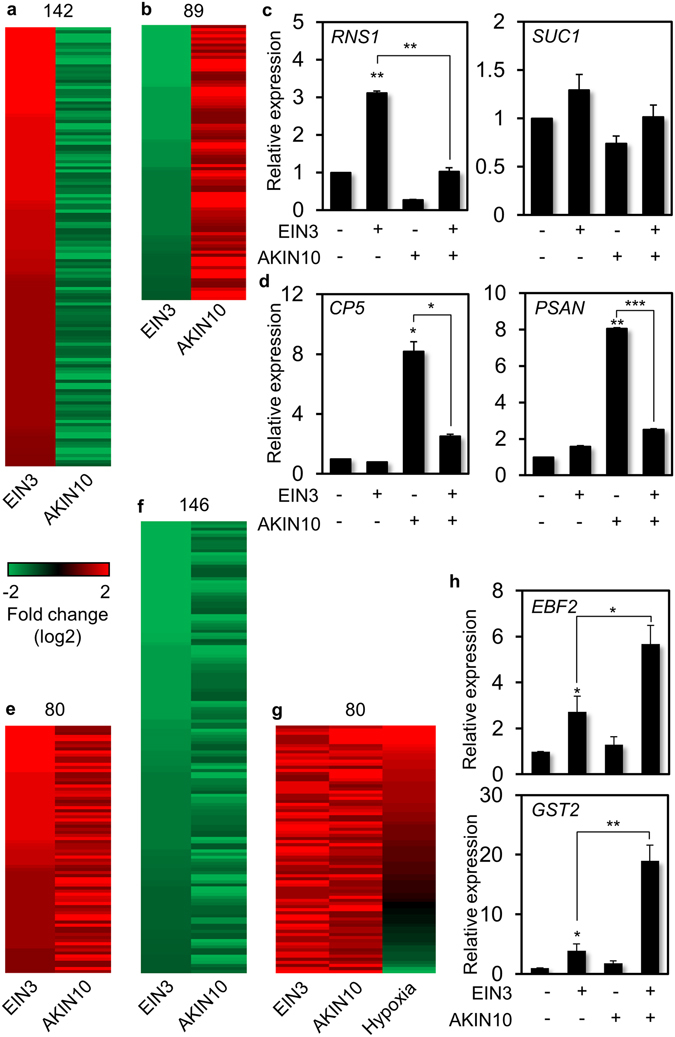
Figure 3.

RNA sequencing-based analysis of differentially expressed genes (DEG) by EIN3 and AKIN10. (a,b) Comparative analysis of DEG up-regulated by EIN3 and down-regulated by AKIN10 (a) and those down-regulated by EIN3 and up-regulated by AKIN10 (b). (c,d) Expression of genes up-regulated by EIN3 and down-regulated by AKIN10 (c) and those down-regulated by EIN3 and up-regulated by AKIN10 (d) were measured using Arabidopsis protoplasts in combination of EIN3 and AKIN10 using RT-qPCR. (e,f) Comparative analysis of DEG up-regulated by both EIN3 and AKIN10 (e) and those down-regulated by both EIN3 and AKIN10 (f). (g) Meta-analysis of DEG up-regulated by both EIN3 and AKIN10 with those by hypoxia. (h) Expression of genes up-regulated by both EIN3 and AKIN10 was measured in combination of EIN3 and AKIN10 using RT-qPCR. (c,d,h) Values are means of triplicates with standard error bars (*p < 0.001; **p < 0.01; ***p < 0.05). All experiments were repeated with consistent results.
