
Figure 1.
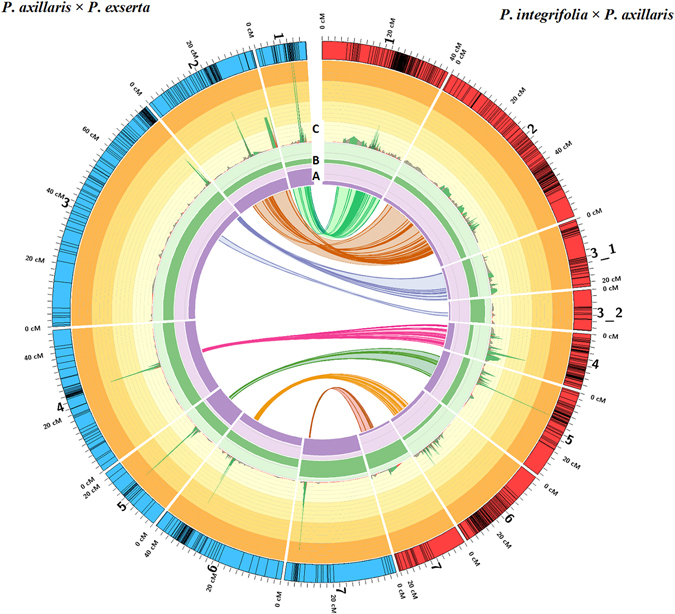
Genetic map of P. integrifolia × P. axillaris (IA) and P. axillaris × P. exserta (AE) populations, and the synteny between the linkage groups. Rings represent: (A) Average number of markers per bin; the darker purple shade indicates range from 0 to 31; (B) Average distance (in cM) between bins (or between markers for the IA map); the darker green shade indicates ranges from 0 to 1.6 cM; (C) SNP frequency; each different shade of yellow indicates a 1% increase, the minimum percentage shown is 0.03% and the maximum percentage shown is 4%.