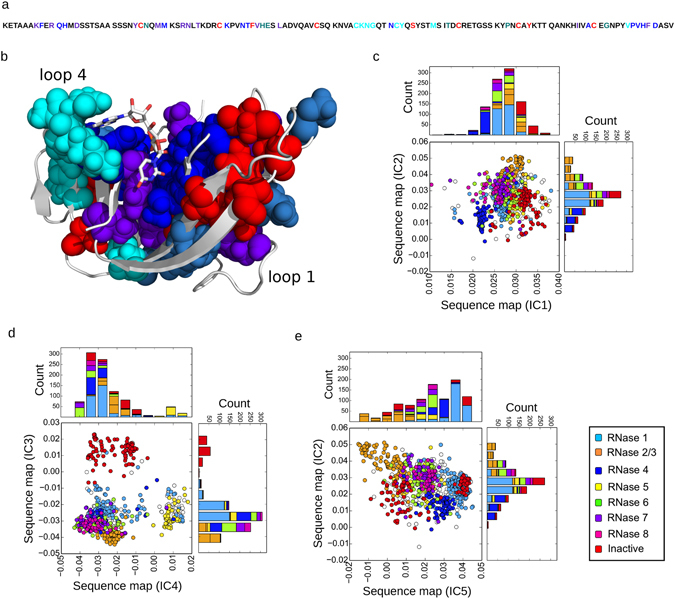
Figure 1.

Co-evolving residue networks in the ptRNase superfamily. (a) Residue positions of the top five significant eigenmodes (ICs 1–5) are colored red, purple, blue, cyan and teal, respectively, along the primary structure of RNase A. (b) Amino acid residues of ICs 1–5, displayed using the space-filling model, mapped on the 3D structure of RNase A (PDB 7RSA). (c–e) Each panel shows the scatterplot of sequences (each circle representing a single sequence) along each IC corresponding to sequence variations of positions contributing to each IC. Stacked histograms show the distribution of sequences along each IC. Sequences are colored based on the RNase subtypes found in the entire vertebrate family (RNases 1–8 and inactive members). Sequence distributions along ICs 1 and 2, 3 and 4, 5 and 2 are shown in panels c, d, and e, respectively.
