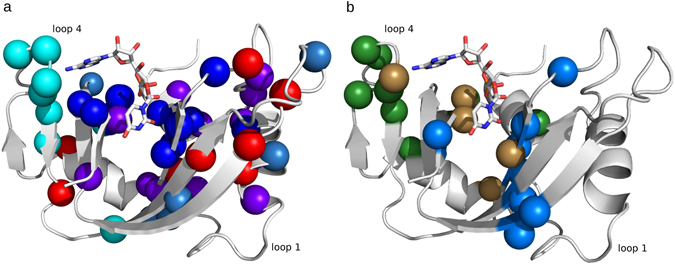
Figure 2.

Functional role of co-evolving amino acid networks of ptRNase sectors. (a) Amino acid residues of ICs 1–5, displayed as spheres corresponding to Cα atoms, mapped on the 3D structure of RNase A (PDB 7RSA). ICs 1–5 are displayed in red, purple, blue, cyan, and teal spheres, respectively. (b) Spheres represent Cα atoms of residues that show NMR chemical shift variations (Δδ) > 0.1 ppm upon incremental titration of RNase A with 5′-AMP (green) and 3′-UMP (marine blue). Brown spheres correspond to residues perturbed by both ligands. Positions of single nucleotide ligands adenosine-5′-monophosphate (5′-AMP) and uridine-3′-monophosphate (3′-UMP), obtained from PDBs 1Z6S and 1O0N, are displayed using stick representations in all Figures. Ligand atoms are colored using the standard coloring scheme – nitrogen, oxygen, carbon and phosphorus as blue, red, white and orange, respectively.
