
Figure 3.
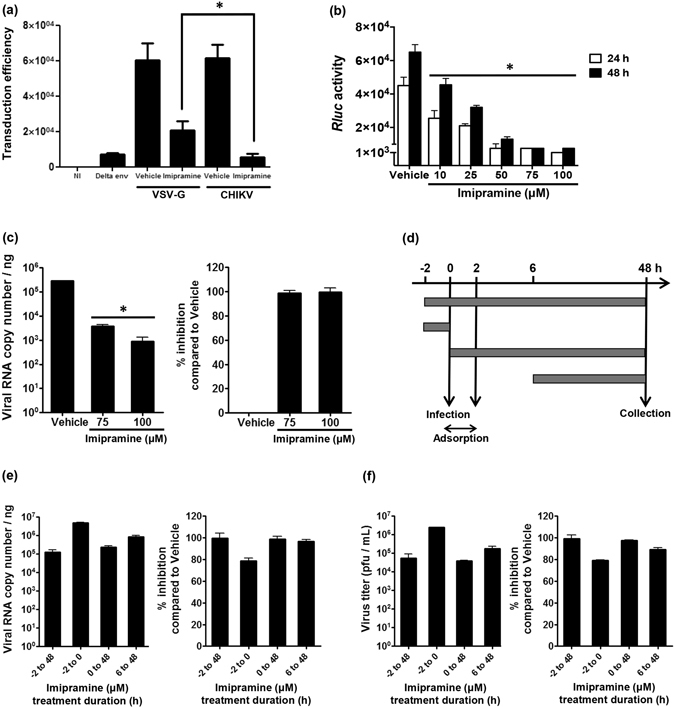
Imipramine exerts its inhibitory effects at different stages of the viral life cycle. (a) Human primary skin fibroblasts were either treated with 75 µM imipramine or with PBS (vehicle) for 24 h and then challenged with CHIKV Env- or VSV-G-pseudotyped HIV particles. HIV particles devoid of envelope were used to monitor potential pseudo-transduction events. Transduction of the cells was monitored by quantification of GFP expression in the cells after 48 h. Values are normalized according to protein contents of the cell extract and correspond to the mean of triplicate ± SD. NI is for non-transduced cells. *p < 0.05. (b) Stable transfected Huh-7 cells with CHIKV-NCT replicon were treated with different concentrations of imipramine. After 24 and 48 h, treated cells were measured for the Renilla Luciferase (Rluc) activity. Vehicle–treated (PBS) cells were used as control (“0”) concentration. Relative Rluc activity expressed by the CHIKV replicon represents CHIKV’s RNA replication. Values are normalized according to protein contents of the cell extract and correspond to the mean of triplicate ± SD. (c) Results of RT-PCR analysis of viral RNA copy numbers in vehicle and imipramine treated cells. Percentage of inhibition (right panel) is calculated as described for Fig. 1. The data represent mean ± SD from three independent experiments. *p < 0.05 when compared to cells treated with vehicle. (d) Schematic presentation of the time-of-addition assay. Human skin fibroblasts, treated as shown with 10 µM, 25 µM, 50 µM, 75 µM or 100 µM of imipramine, were infected with CHIKV La Réunion strain for 48 h. (e) Inhibition of virus RNA synthesis by 75 µM of imipramine was quantified using real time RT-PCR. Viral RNA copy numbers, obtained under different conditions, are shown on the left panel; right panel shows achieved percentage of inhibition calculated as for Fig. 1. (f) Inhibition of infectious virus production by 75 µM of imipramine was analyzed using plaque assay. Virus titers, obtained under different conditions, are shown on the left panel; right panel shows achieved percentage of inhibition calculated as for Fig. 1. Data for all used concentrations is shown on Supplemental Figs S4 and S5.