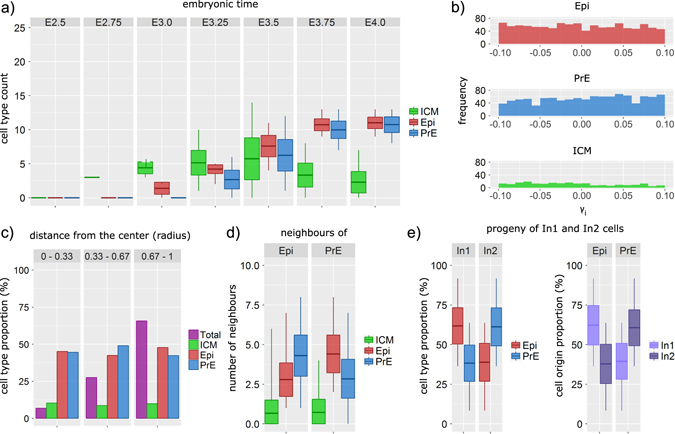
Fig. 3.

Analysis of the simulated embryos with the default values of parameters given in Supplementary Tables S1–S3. The analysis is done for a sample of 100 simulated embryos. a Evolution of ICM, Epi and PrE by cell count from E2.5 to E4.0. The darker lines in the boxes show the mean values, the boxes show the standard deviation, whereas the vertical lines indicate the minimal and maximal value of the sample. b Distribution of the final random parameter γ i for each of the three cell fates—epiblast (Epi, red), primitive endoderm (PrE, blue) and inner cell mass (ICM, green) showing the absence of correlation between the final value of γ i and the cell fate. c Spatial distribution of each cell type at various distances from the centre of the embryo. The distances are normalised by the radius of the embryo. The total number of cells (magenta) shows how many cells were observed at each layer compared with the number of cells in the whole embryo. d Number of neighbouring cells by type surrounding Epi (left) and PrE cells (right), showing that Epi cells are surrounded by more PrE cells than by cells of their own type, and vice versa. e On the left hand side—the proportions of Epi and PrE cells in In1 and In2 cell progeny. On the right hand side—the proportions of In1 and In2 originating cells in the final Epi and PrE cell population
