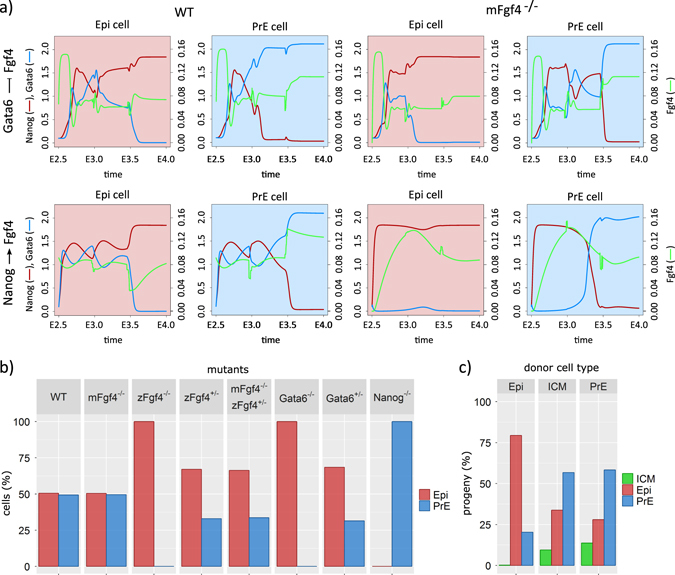
Fig. 4.

a Evolution of Nanog (red curve), Gata6 (blue curve) and Fgf4 (green curve) concentrations in an Epi and a PrE cell in wild type (left) and maternal Fgf4 mutant (right) with two hypotheses—the current model described in Fig. 1 (top) and the previous model described in refs. 7 and 26. In the current model, Fgf4 is inhibited by Gata6, whereas in the previous one it was activated by Nanog. b The proportion of epiblast (Epi) and primitive endoderm (PrE) progeny in different in silico mutants as indicated above the histograms. Mutants are simulated by setting the rates of synthesis of the appropriate compound to 0 for full mutants and to 75% of their default value for the heterozygous mutant to account for compensation.7 c Simulations of implantation experiments in which individual cells were taken at three different stages of the embryo development (E3.75, E3.75, E4.25) and implanted in host embryos at E2.5. Results obtained for the different ages of the donor embryos are pooled together. The three graphs show the composition of the progeny of the Epi, inner cell mass (ICM) and PrE donor cells
