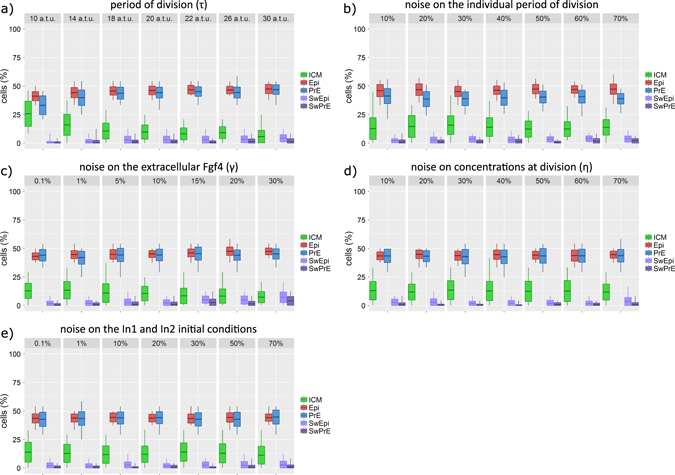
Fig. 6.

Analysis of embryo development sensitivity on: a the mean division period (τ), b the noise on the timing of individual cell divisions, c the noise on the extracellular Fgf4 (γ), d the noise on repartition of gene regulatory network (GRN) factors in daughter cells at division (η), e the noise on the initial conditions of Nanog, Gata6, Fgf receptors and Erk in both In1 and In2 cells. Each graph shows the mean cell count, standard deviation (box) and minimal and maximal cell count (vertical line) at E4.0 for inner cell mass (ICM), epiblast (Epi), primitive endoderm (PrE) cells and as well as for the number of switches from PrE to Epi (SwEpi) and from Epi to PrE (SwPrE). a and b show that the model is quite robust on the moderate changes in the cell division period and on the noise on the timing of individual cell divisions. A more detailed description of the analysis presented in this figure is given in section 5 of Supplementary Information
