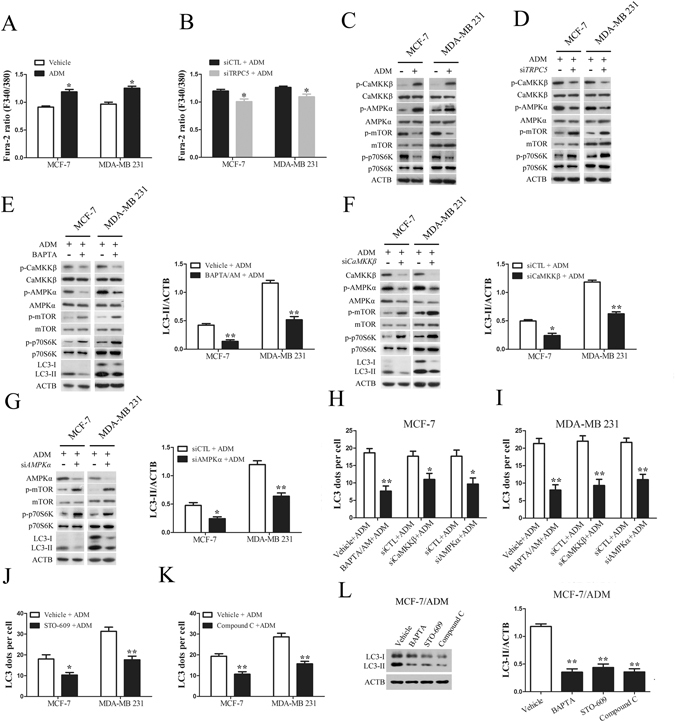
Figure 4.

TRPC5 induces autophagy via the CaMKKβ/AMPKα/mTOR pathway in response to chemotherapy. (A and B) Treatment of indicated cells with ADM for 48 h increased the basal [Ca2+]i and siTRPC5 blocked the ADM-induced increase in [Ca2+]i. (C) Exposure of indicated cells to ADM for 48 h was followed by analysis of the protein levels of p-CaMKKβ, CaMKKβ, p-AMPKα, AMPKα, p-mTOR, mTOR, p-p70S6K, p70S6K and ACTB by western blot. (D) The effect of TRPC5 silencing on the protein levels of p-CaMKKβ, CaMKKβ, p-AMPKα, AMPKα, p-mTOR, mTOR, p-p70S6K, p70S6K and ACTB in indicated cells exposed to ADM. (E) The effect of 20 µmol/L BAPTA/AM on the protein levels of p-CaMKKβ, CaMKKβ, p-AMPKα, AMPKα, p-mTOR, mTOR, p-p70S6K, p70S6K, LC3 and ACTB in indicated cells exposed to ADM. (F) The effect of CaMKKβ silencing on the protein of CaMKKβ, p-AMPKα, AMPKα, p-mTOR, mTOR, p-p70S6K, p70S6K, LC3 and ACTB in indicated cells treated with ADM. (G) The effect of AMPKα silencing on the protein levels of AMPKα, p-mTOR, mTOR, p-p70S6K, p70S6K, LC3 and ACTB in indicated cells exposed to ADM. (H and I) The effect of BAPTA/AM, siCaMKKβ and siAMPKα on ADM induced LC3 puncta formation in indicated cells. (J and K) The effect of 10 µmol/L STO-609 and 5 µmol/L compound C on ADM induced LC3 puncta formation in indicated cells. (L) The effect of BAPTA/AM, STO-609 and compound C on accumulation of LC3-II in MCF-7/ADM cells. Values are mean ± SEM of 3 to 6 experiments. *p < 0.05, **p < 0.01, compared to siCTL or vehicle.
