Figure 2.

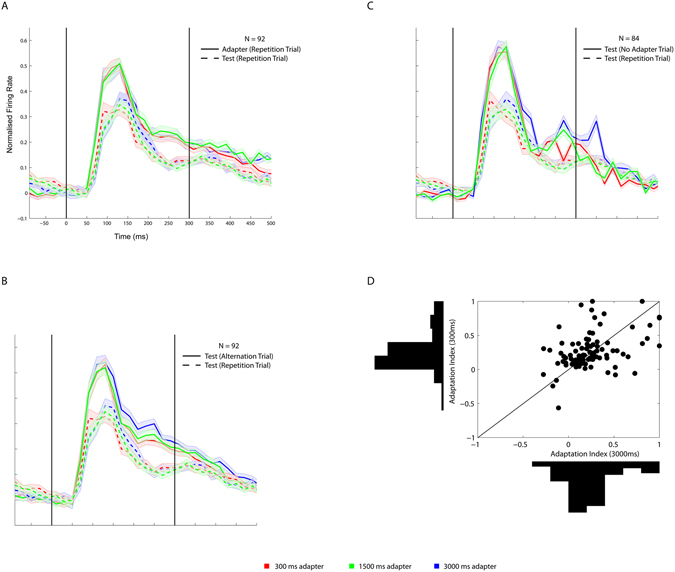
Responses to adapter and test stimuli as a function of adapter duration. (A) Normalized net firing rate to adapter and test stimuli in repetition trials for the 3 adapter durations. 0 corresponds to the onset of the adapter or test stimulus. The two vertical lines indicate the duration of the test stimulus and the adapter in the 300 ms duration condition. For the longer adapter durations, we show only the responses for the initial 500 ms of the stimulus presentation. (B) Normalized net firing rate to test stimuli in repetition and alternation trials for the 3 adapter duration conditions. Same neurons as in A. Same conventions as in A. (C) Normalized net responses to the same test stimuli without adapter (no adapter trial) or an adapter in repetition trials. The 84 neurons are a subsample of the 92 neurons in A and B. Same conventions as in A. Binwidth is 20 ms and no smoothing was applied. Shaded bands correspond to standard error of the mean. (D) Scatter plot and marginal distributions of adaptation contrast indices for 3000 ms (x-axis) and 300 ms (y-axis) adapter durations. The diagonal (equal x and y values) is indicated by a black line.
