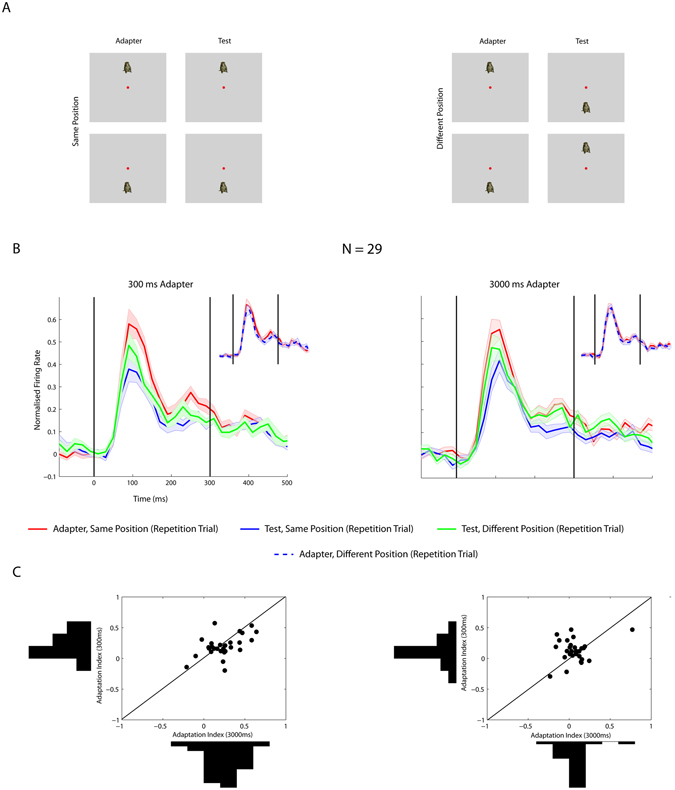
Figure 4.

Repetition suppression when adapter and test stimuli were presented at the same or a different position. (A) Illustration of stimulus conditions. Adapter and test stimuli were presented at the same (left) or different positions above or below the fixation target along the vertical meridian. (B) Normalized firing rate of single IT units to adapter and test stimuli when the adapter and test stimuli were presented at the same position or at a different position during repetition trials. Left: adapter duration equaled 300 ms; right: adapter duration equaled 3000 ms. The insets compare the firing rates to the same adapter stimuli when followed by a test stimulus at the same or a different position. Same conventions as in Fig. 2. (C) Scatter plot and marginal distributions of adaptation contrast indices for 3000 ms (x-axis) and 300 ms (y axis) adapter durations. Left: Adapter and test presented at the same position; right: adapter and test presented at different positions. The diagonal (equal x and y values) is indicated by a black line.
