
Figure 1.
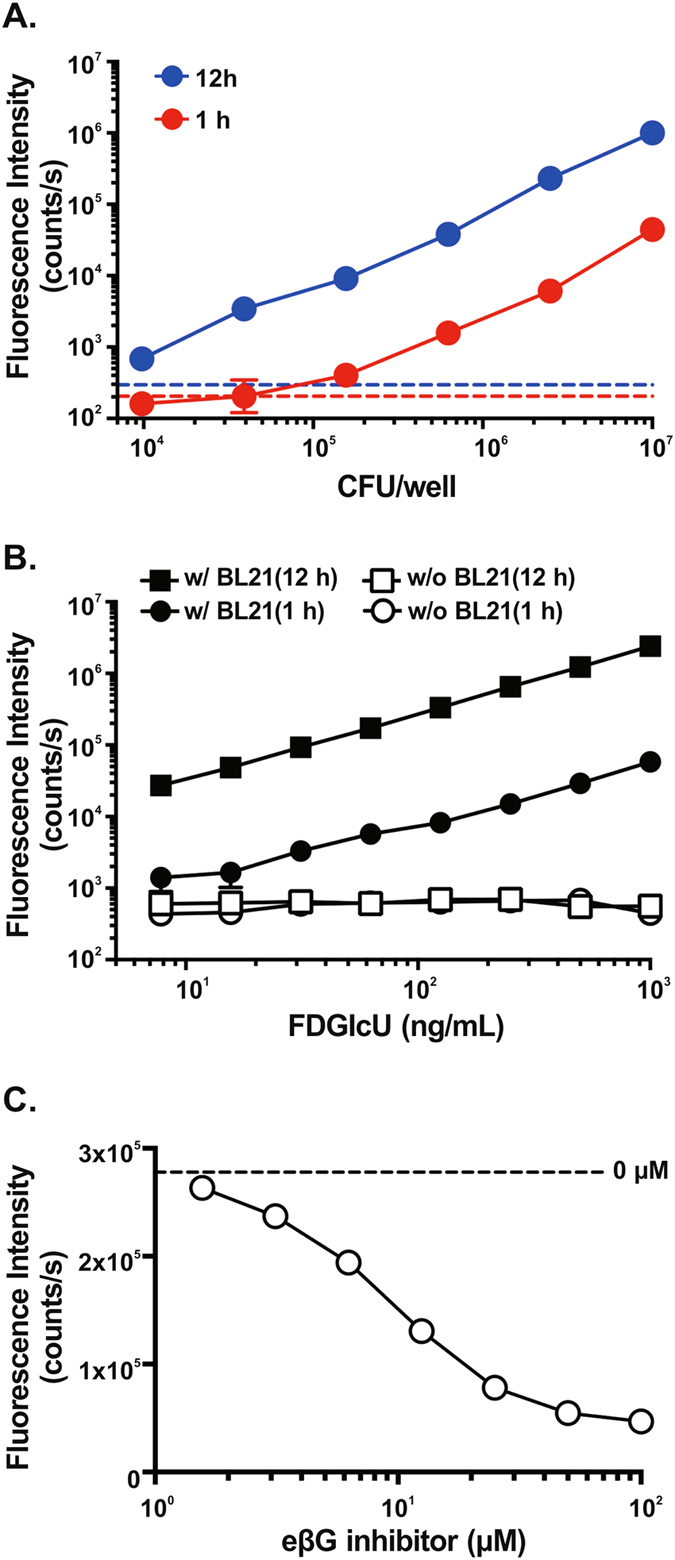
Hydrolysis of FDGlcU in cell-based assays and inhibition by the eβG inhibitor. (A) Fluorescence intensity of 0.5 μg/mL FDGlcU hydrolyzed by various amounts (CFU/well) of BL21 cells after 1-hour (red dots) or 12-hour (blue dots) incubations. Dashed lines indicate the absence of BL21 cells in the 1-hour (red line) or the 12-hour (blue line) incubation. (B) Fluorescence intensity of various concentrations of FDGlcU hydrolyzed by 107 CFU/well of BL21 cells after 1-hour (●) and 12-hour (■) incubations. (☐) and (○) indicate the absence of BL21 cells. (C) Fluorescence intensity of 1 μg/mL of FDGlcU hydrolyzed by 6.25 × 10⁵ CFU/well of BL21 cells in the presence of the eβG inhibitor at various concentrations (μM) after the 12-hour incubation. The dashed line indicates the absence of the eβG inhibitor. Error bars indicate SEM.