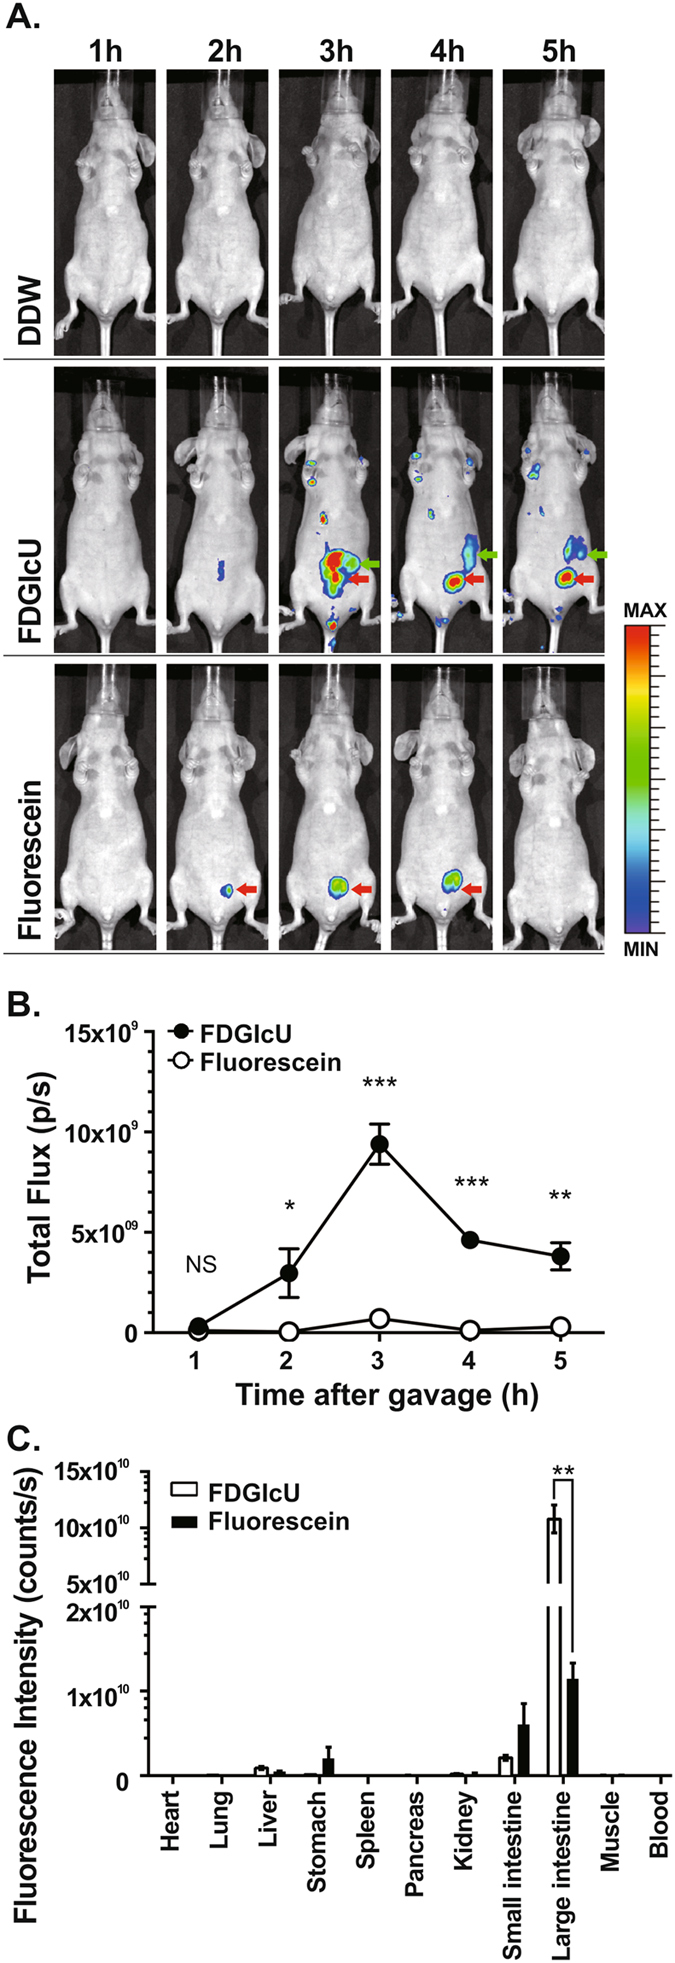
Figure 2.

In vivo optical imaging of βG activity by FDGlcU. (A) Serial whole-body images at indicated time points after oral gavage with DDW (top), FDGlcU (middle), and fluorescein (bottom). Green arrows indicate intestine and red arrows indicate bladder. (B) Total flux in abdomens of mice gavaged with FDGlcU (●) (n = 5) or fluorescein (○) (n = 5). (C) The regions of interest in different organs and tissues after oral administration of FDGlcU (n = 3) or fluorescein (n = 3) for 3 hours were analyzed with Living Image software. Error bars indicate SEM. NS, no significant difference. *P value < 0.05. **P value < 0.01. ***P value < 0.001.
