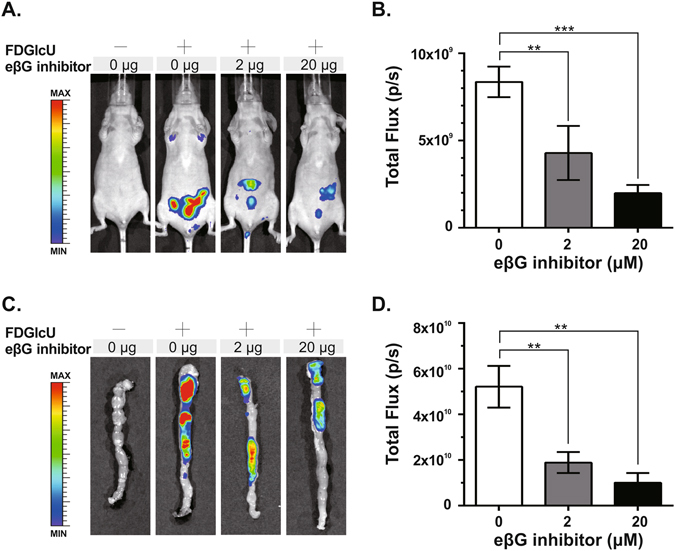
Figure 3.

Optical imaging of inhibition of intestinal bacterial βG by the eβG inhibitor. (A) Mice were gavaged with the eβG inhibitor (0 μg, 2 μg, or 20 μg) 4 hours before FDGlcU administration, then whole-body imaging was performed 3 hours later. Control mice were gavaged with vehicle solution. (B) The fluorescent signal from the murine abdomens of each group (n = 6) was measured. (C) Imaging of excised large intestines after whole-body imaging at the 3-hour time point. (D) The fluorescent signal from the intestines of each group (n = 6) was measured. Error bars indicate SEM. **P value < 0.01. ***P value < 0.001.
