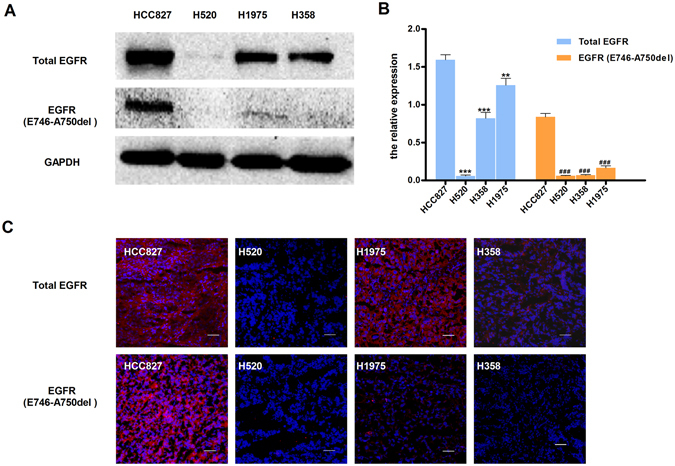
Figure 5.

Western blot and immunofluorescence of tumors derived from HCC827, H520, H1975 and H358 cell lines. (A) Representative Western blots of four human NSCLC tissue lysates comparing the extent of EGFR and EGFR-specific E749-A750del mutation expression. GAPDH served as a reference for equal loading. HCC827 tissue has high EGFR and EGFR-specific E749-A750del mutation EGFR (B) Western blot analysis of proteins in EGFR and EGFR-specific E749-A750del mutation (n = 3). Data are presented as mean ± SD. **P < 0.01 vs. HCC827 group in total EGFR. ***P < 0.001 vs. HCC827 group in total EGFR. ### P < 0.001 vs. HCC827 group in EGFR EGFR-specific E749-A750del mutation.(C) The immunofluorescence in tumors confirms western blot results. (Red color is from secondary antibody Alexa Fluor®549, and blue color from DAPI for nuclear visualization). All scale bars, 100 μm.
