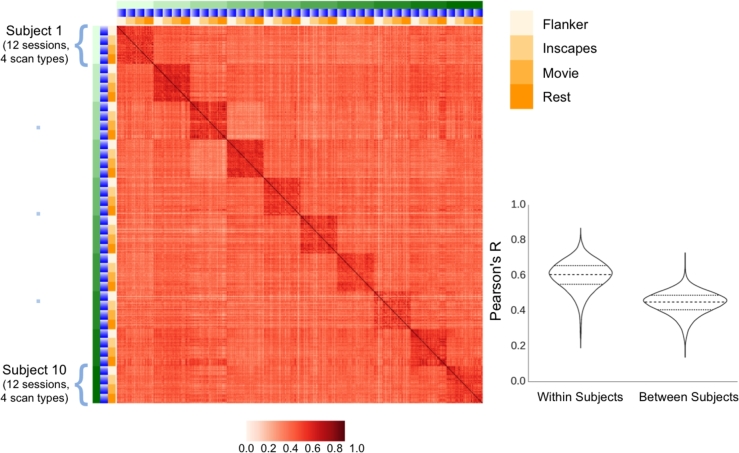
Figure 5.
Similarity of full-brain connectivity matrices across participants (green), sessions (blue), and scan conditions (yellow), as measured using Pearson correlation coefficients (red). Also depicted in the bottom right are the distributions of correlation coefficients when comparing scans from the same subject (within subject), and scans from different subjects (between subject). In the right column are the values for scans from the same subject, and in the left are scans from different subjects. The median, first, and third quartiles are also depicted with horizontal lines.

