
Fig. 2.
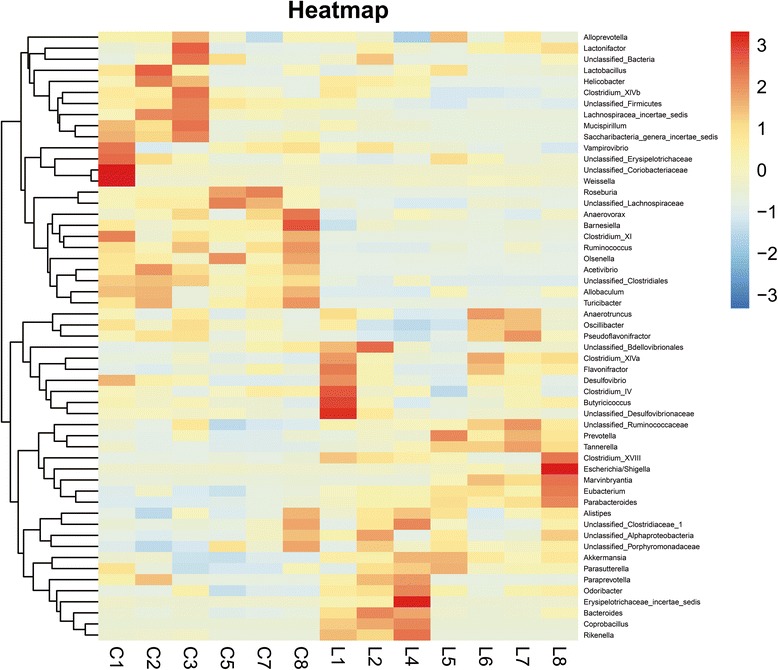
Heat-map diagram of the gut microbiota composition at genus level for all diet groups. The 55 genera that were shared by all samples tested (core microbiome) are displayed
Official websites use .gov
A
.gov website belongs to an official
government organization in the United States.
Secure .gov websites use HTTPS
A lock (
) or https:// means you've safely
connected to the .gov website. Share sensitive
information only on official, secure websites.
Heat-map diagram of the gut microbiota composition at genus level for all diet groups. The 55 genera that were shared by all samples tested (core microbiome) are displayed