
Fig. 3.
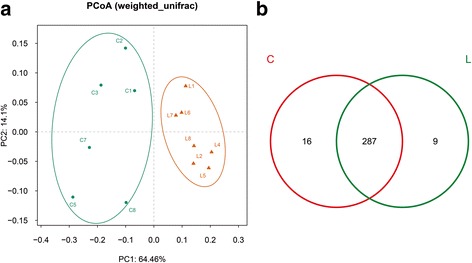
β-diversity and community similarity analysis of the microcosm composition. a Principal coordinates analysis (PCoA, weighted) of the microcosm composition. b Venn diagram representing shared and unique OTUs of the gut microbiome. Numbers in the diagram represent the number of OTUs in the different groups. There are 312 OTUs in all groups. C = chow group; L = LD group