
Fig. 4.
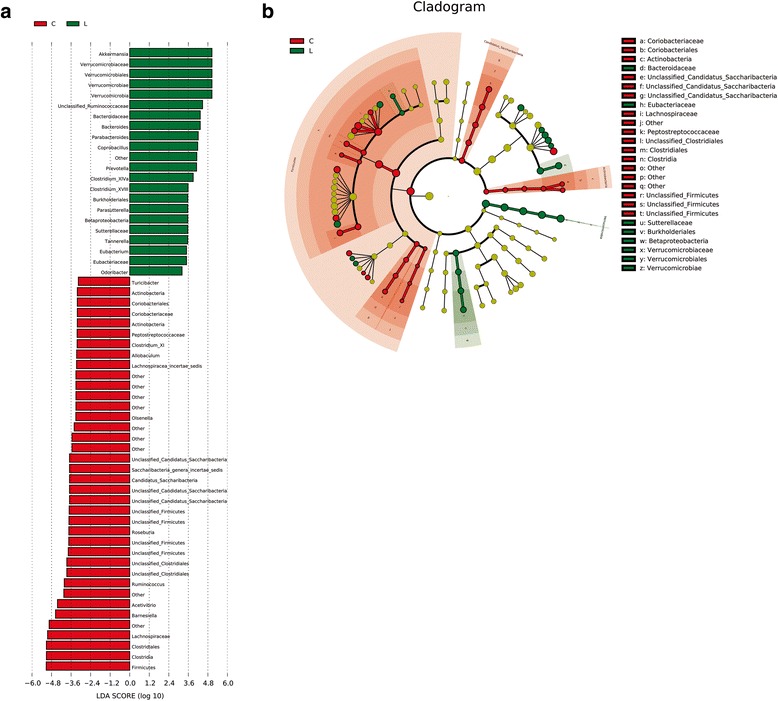
Different structures of gut microbiota in chow and LD group by LEfSE analysis. a Specific phylotypes of gut bacteria in response to lithogenic diet using LEfSe. The histogram shows the LDA scores computed for features at the OTU level. The lateral text shows the taxonomic profiles of all the OTUs, which were significantly different between the LD and the chow groups. b LEfSe cladogram in red for the taxa enriched in chow group and in green for the taxa enriched in LD group. The diameter of each circle is proportional to its abundance. C = chow group; L = LD group