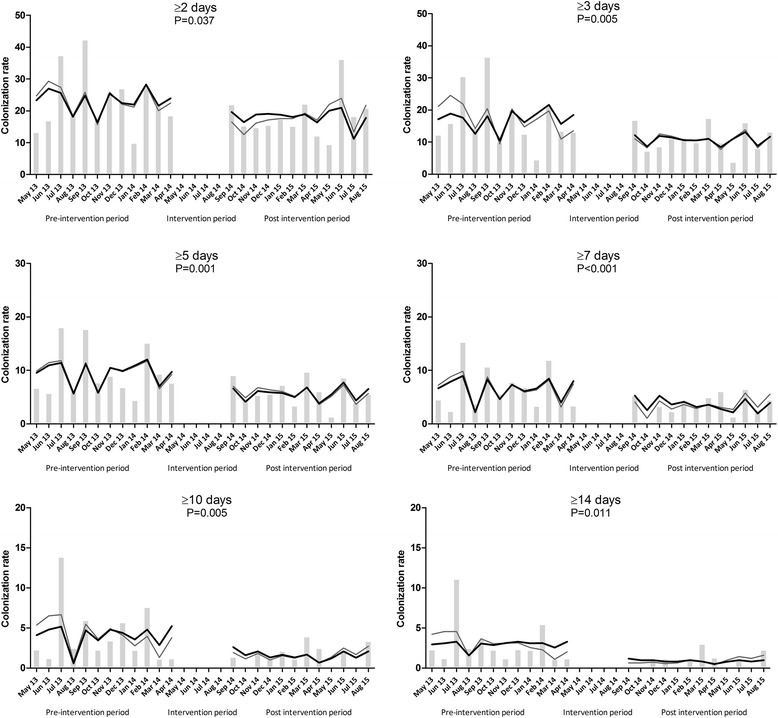
Fig. 2.

Monthly gram-negative bacilli (GNB) colonization rates. Legend: Monthly GNB colonization rates (bars), the predicated rate based on the full model (grey line) and the predicted rate based on the parsimonious model (black line). β2 level change p-values are shown in 2A to 2F, where β2 stands for the level change in the monthly colonization rate immediately after the intervention. Section A to F refer to GNB identified in ICU patients with a length of stay of ≥2, ≥3, ≥5, ≥7, ≥10 or ≥14 days after ICU admission
