Fig. 2.

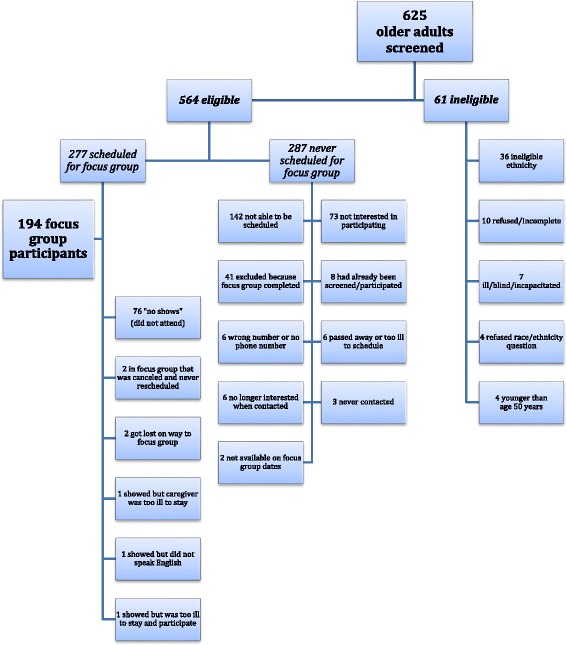
This flow chart details the screening and participation numbers of racial/ethnic minority older adults for a social science research study, as well as the reasons for ineligibility and nonparticipation in focus groups

This flow chart details the screening and participation numbers of racial/ethnic minority older adults for a social science research study, as well as the reasons for ineligibility and nonparticipation in focus groups