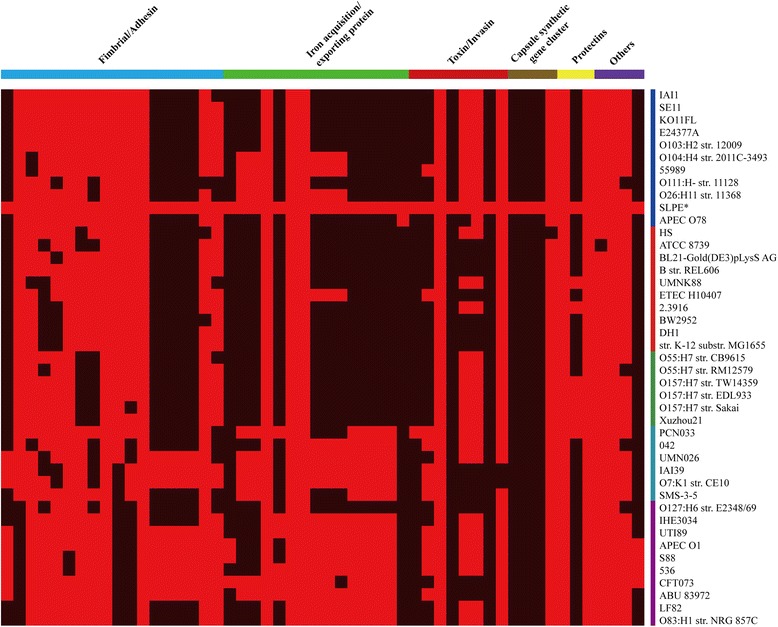
Fig. 3.

The distribution diagram of the pan-genome virulence genes among 43 E. coli strains. The right side of the vertical line shows E. coli strains that are consistent with the phylogenetic tree (Figure 2) with the following labels: (1) B1 monophyletic phylogroup, blue; (2) A monophyletic phylogroup, red; (3) E monophyletic phylogroup, green; (4) D monophyletic phylogroup, cyan and (5) B2 monophyletic phylogroup, purple. The SLPE strains are highlighted with the key symbol. The top shows the following six classified clusters: (1) fimbrial/adhesin, blue; (2) iron acquisition/exporting protein, green; (3) toxin/invasin, red; (4) capsule synthetic gene cluster, brown; (5) protectins, yellow and (6) others, purple. The red and black bodies show the distribution of the virulence genes among these strains. A red side implies that the virulence genes are present, while the black side implies that the genes are absent
