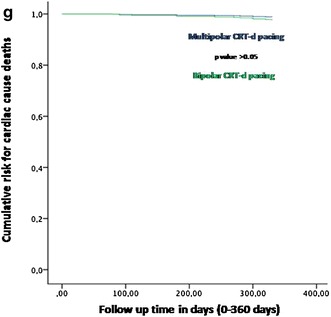
Fig. 3.

In this figure the representation of cumulative survival events free curves for study endpoints, by Cox regression analysis curves. In the part of the curve, the representation of cardiac deaths events as “cumulative risk for cardiac deaths events” (on y axis) during 360 days follow up (on x axis) comparing multipolar vs bipolar group
