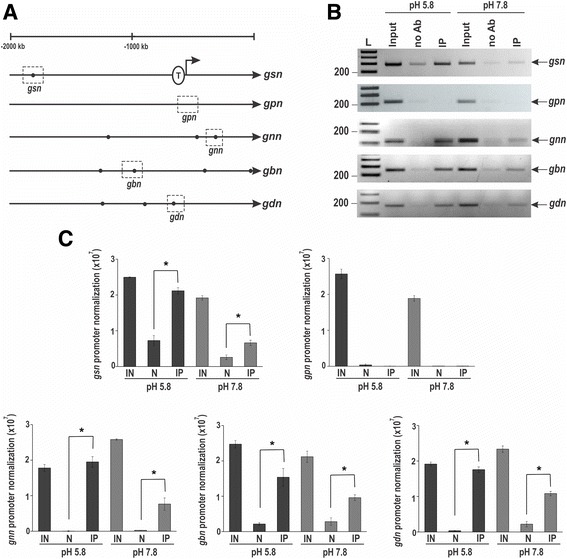
Fig. 3.

Binding of PAC-3 to the glycogenic gene promoters at normal growth pH (5.8) and alkaline pH (7.8). a Schematic representation of the PAC-3 DNA binding sites in the 5′-flanking regions of the glycogenic gene promoters. The black dots indicate the position of the PAC-3 motifs (5′-BGCCVAGV-3′) [33] identified and the dashed boxes indicate regions that were analyzed by ChIP-PCR. The transcription initiation site (T) in gsn was experimentally determined [11]. b Genomic DNA samples from the Δpac-3 pac-3 + complemented strain subjected to pH 7.8 stress or not subjected to it (pH 5.8) were immunoprecipitated with anti-mCherry antibody and subjected to PCR to amplify DNA fragments containing the PAC-3 motif. A DNA fragment from the gpn promoter, which does not have a PAC-3 motif, was used as a negative control of binding. The input DNA was used as a positive control and the non-immunoprecipitated reaction (no Ab) as the negative control. L, 1 kb DNA ladder. c The DNA bands from ChIP-PCR were quantified by ImageJ, and the results are shown. Asterisks indicate significant difference between no Ab (N) and immunoprecipitated (IP) at the same pH (Student’s t-test, P < 0.01). IN, Input DNA. All results represent the average of at least two independent experiments. Bars indicate the standard deviation from the biological experiments
