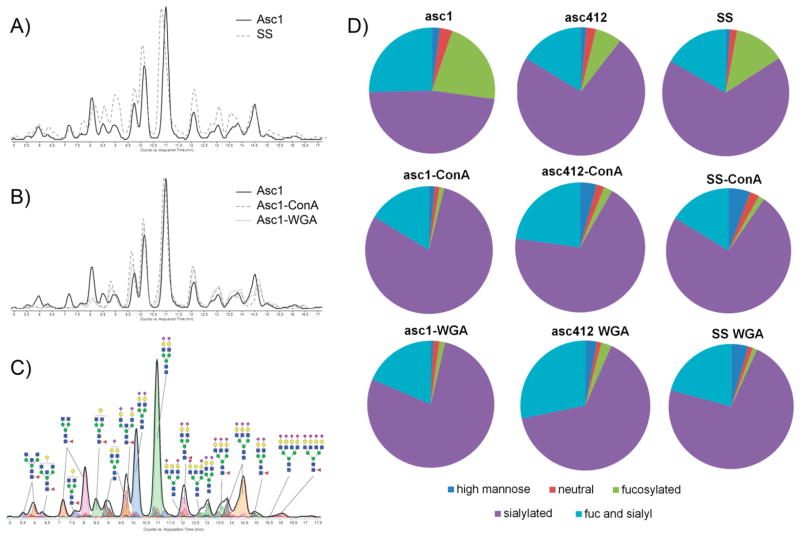
Figure 2.
Nano-LC Chip/TOF MS analysis of N-glycans released from proteins present in OC ascites fluid and ConA- and WGA-bound ascites. (A) Comparison of glycan chromatographs between a serum control and ascites fluid (solid line represents ascites fluid, dotted line represents serum control). (B) Comparison of chromatographs of N-glycans isolated from ascites and ConA- and WGA-bound proteins (solid line represents ascites fluid, dashed line represents ConA, and dotted line represents WGA glycans). (C) Annotated N-glycan profile of the ascites fluid analyzed by nano-LC Chip/TOF MS. (D) Pie charts of the different types (classes) of N-glycans obtained from OC ascites fluid and ConA- and WGA-bound proteins.

