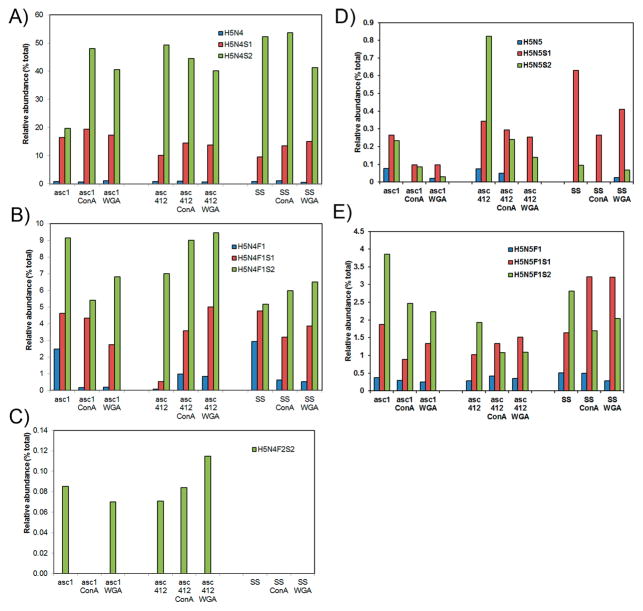
Figure 3.
Comparative analysis of N-glycans obtained from two ascites samples Asc1 and Asc412 and a serum control sample (SS). (A) Abundant N-glycans H5N4, H5N4S1, and H5N4S2 N-glycans before and after lectin (ConA or WGA) binding in Asc1 (left), Asc412 (middle), and SS (right); (B) H5N4F1, H5N4F1S1, and H5N4F1S2 N-glycans; (C) H5N4F2S2 N-glycan; (D) H5N5, H5N5S1, and H5N5S2 N-glycans; and (E) H5N5F1, H5N5F1S1, and H5N5F1S2 N-glycans. H represents hexose; N represents N-acetyl glucosamine or GlcNAc; F represents fucose; S represents sialic acid.

