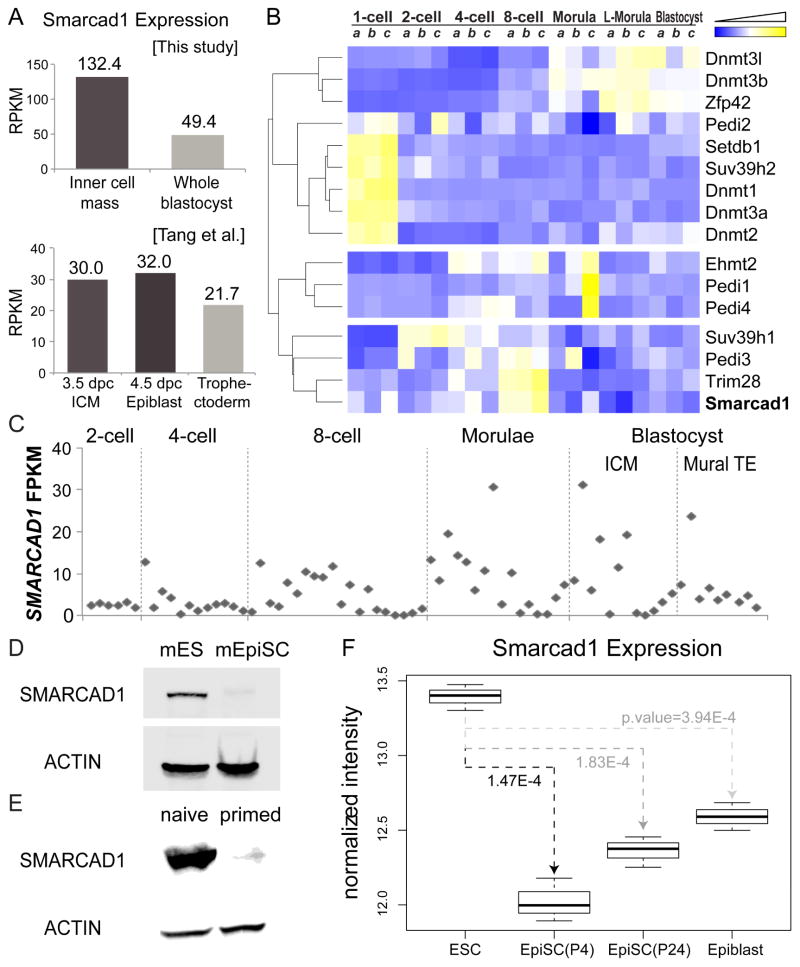
Figure 1. Smarcad1 expression patterns in early embryonic development and in pluripotent stem cells.
(A) RNA-seq derived Smarcad1 mRNA levels in ICM, whole blastocyst, trophectoderm, and epiblast. dpc: days post conception. (B) Expression heatmap of genes related to DNA methylation, H3K9 methylation, and histone citrullination. Three biological replicates (a, b, c) were analyzed in each of 7 stages in mouse preimplantation development. L-Morula: late morula stage. Gene expression levels were normalized across samples, clustered (dendrogram), and visualized (yellow: high expression, blue: low expression). (C) SMARCAD1 expression (y axis) in single cells of human preimplantation embryos (GEO: GSE36552). Each column represents a single cell, and the cells were grouped by developmental stage (x axis). TE: trophectoderm. (D–E) Western blots of SMARCAD1 and ACTIN in mouse ES cells and EpiSCs (D), and in pig naïve and primed pluripotent cells (E). (F) Microarray derived Smarcad1 expression levels in mouse ES cells, EpiSC, and epiblast. P4, P24: denotes passages 4 and 24.

