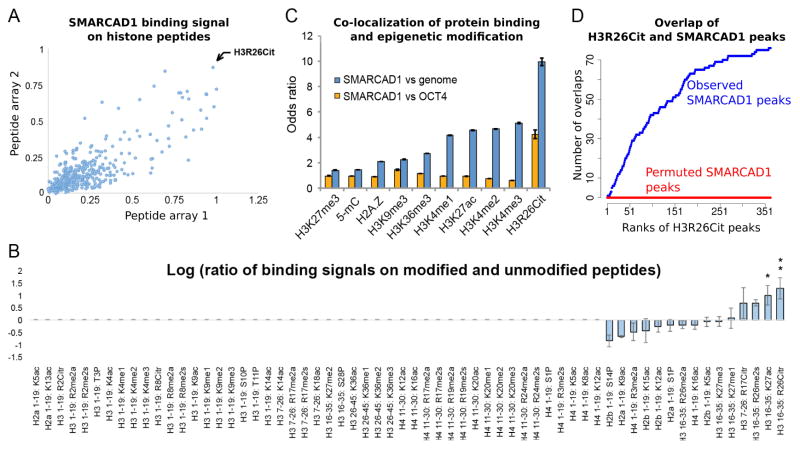
Figure 2. SMARCAD1 recognizes H3R26Cit in vitro and co-localizes with H3R26Cit in vivo.
(A) Binding signals of SMARCAD1 on MODified™ histone peptide arrays. Each dot represents the binding intensities to a peptide, that is modified with a unique combination of post-transcriptional modifications, on array 1 (x axis) and array 2 (y axis). (B) Binding signals on post-translationally modified versus unmodified peptide (log ratio, y axis). All the peptides with a single modification and the unmodified peptides are shown (columns). If the raw binding signal to a modified peptide was smaller than the average binding signal to background peptides, the log ratio was assigned to 0 (non-informative, Columns 1 – 50). If the raw binding signal was above background, this binding signal was divided by that of another peptide with identical amino acid sequence without any modification (y axis, in log scale). Error bar: standard deviation of the mean. *: signal > 3-fold background in one array. **: signal > 3-fold background in both arrays. (C) Relative levels (y axis) of co-localization of SMARCAD1 and each epigenetic modification (x axis), using the entire genome (blue bars) or OCT4 (orange bars) as the controls. Odds ratio > 1 or < 1 corresponds to an increased or decreased level of co-localization. (D) Cumulative counts of overlaps (y axis) of SMARCAD1 and H3R26Cit peaks, ordered by the significance (MACS reported p-value) of H3R26Cit peaks (x axis). Red curve shows the overlaps from a permutation analysis where SMARCAD1 peaks were randomly shifted to other genomic locations, while keeping the size of each peak and the locations of the H3R26Cit peaks.

