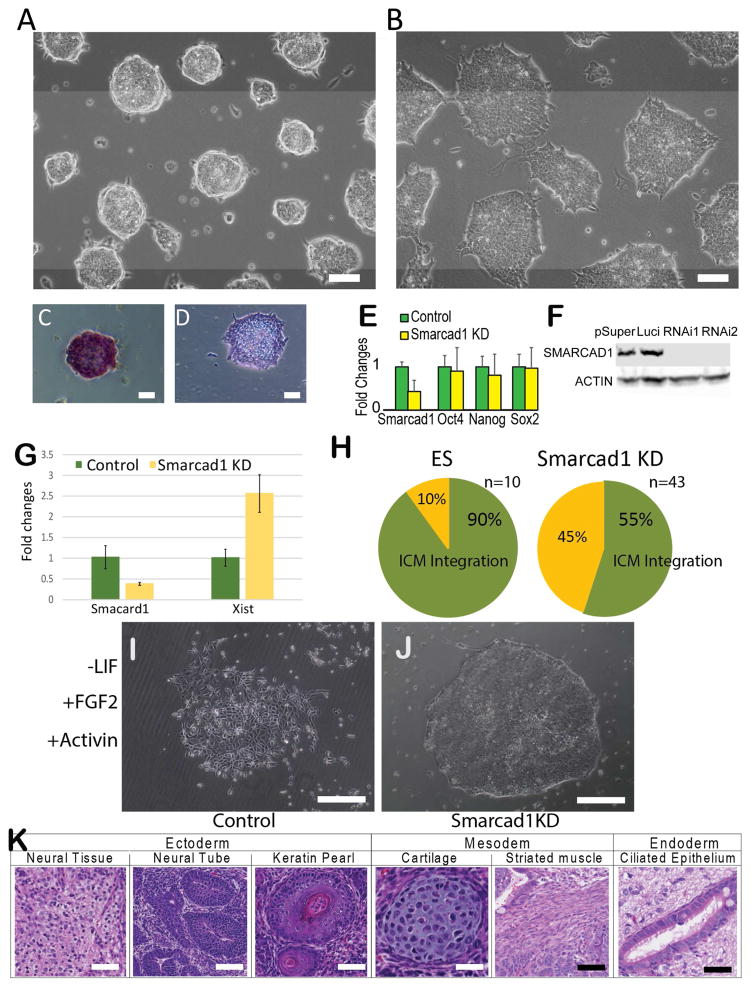
Figure 3. Smarcad1 knockdown in mouse ES cells.
Mouse ES cells transfected with a control shRNA (A) and a Smarcad1 targeting shRNA (B). AP staining of control (C) and SMARCAD1 KD cells (D). (E) RT-PCR derived expression fold changes between Smarcad1 KD and control knockdown cells (Control). Error bars were derived from three biological replicates. (F) Western blots. pSuper: empty vector control. Luci: control knockdown. RNAi1, RNAi2: two shRNAs targeting different parts of Smarcad1 mRNA. (G) Xist expression measured by qPCR in control (Luciferase KD) El16.6 (green) and Smarcad1 KD El16.6 ES cells (yellow). (H) Proportions of injected embryos with ICM integration. (I–J) Control (Luciferase KD) (I) and Smarcad1 KD (J) ES cells cultured under EpiSC culture condition. (K) Tissues and cell types identified by histological staining of EBs derived from SMARCAD1 KD E14 ES cells. Scar bar = 100 μm in panels A–D, and I–K.

