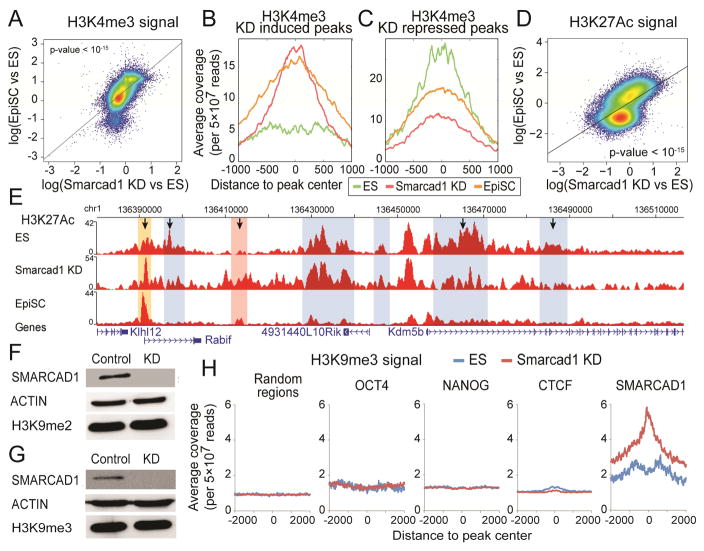
Figure 4. Epigenomic difference between Smarcad1 KD and ES cells.
(A) H3K4me3 changes (log ratio) between Smarcad1 KD and control ES cells (x axis), versus H3K4me3 changes (log ratio) between EpiSC and ES cells (y axis). Each dot represents an H3K4me3 peak identified in either EpiSC or ES cells. A total of 27,431 peaks (the union of 16,115 peaks in ES cells and 28,431 peaks in EpiSC) are plotted. (B–C) Average H3K4me3 ChIP-seq intensities (y axis) in Smarcad1 KD cells (red), ES cells (green), and EpiSC cells (yellow), in a total of 565 Smarcad1 KD induced peaks (B), and a total of 496 Smarcad1 KD repressed peaks (C). (D) H3K27ac differences between Smarcad1 KD and ES cells (x axis) versus H3K27ac changes between EpiSC and ES cells (y axis) on the union of H3K27ac peaks (43,797) identified from EpiSC and ES cells. (E) H3K27ac distribution near the Kdm5b locus in ES cells, Smarcad1 KD, and EpiSC, marked with previously (Factor et al.) identified ES-specific peaks (blue) and EpiSC-specific peaks (pink). H3K27ac in Smarcad1 KD exhibited reduced signals in 3 ES-specific peaks and increased signals in the EpiSC-specific peak (marked with arrows). A new H3K27ac peak was identified (yellow), where both EpiSC and Smarcad1 KD exhibited increased signals as compared to ES cells. (F–G) Western blots of H3K9me2 (F) and H3K9me3 (G) in Control (Luciferase KD) and Smarcad1 KD (KD) mouse ES cells. (H) Average H3K9me3 ChIP-Seq signals (read counts per 5×10⁷ reads, color bar) in ES cells (left) and Smarcad1 KD cells (right) are plotted against the distances to peak centers (x axis, peak center = 0) of 9 chromatin binding proteins (rows). A total of 10,000 random genomic locations are also included (last row).

