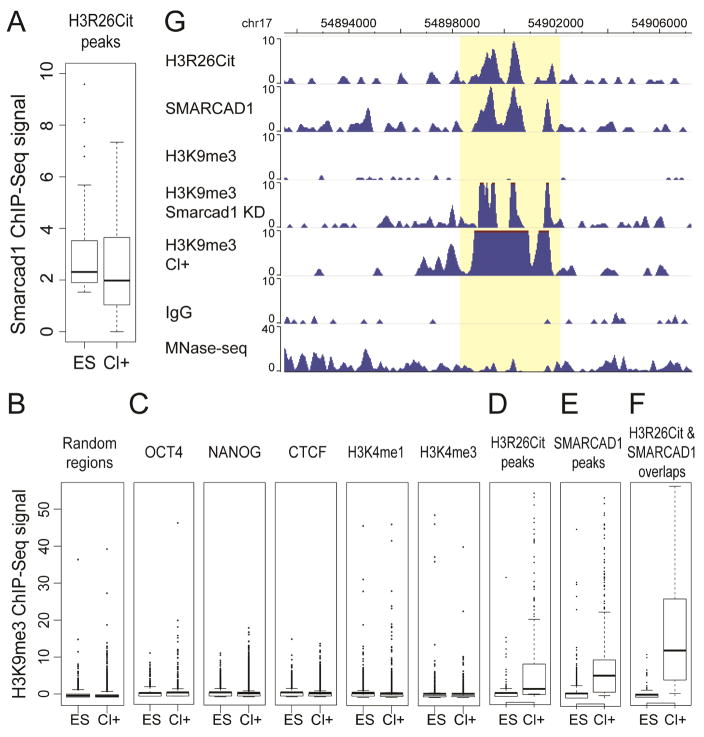
Figure 5. SMARCAD1 and H3K9me3 changes in Cl-Amidine treatment.
(A) SMARCAD1 ChIP-seq intensities in Cl-Amidine treated (Cl+) and untreated ES cells. (B–F) H3K9me3 ChIP-seq intensities in Cl+ and ES cells in 10,000 random genomic regions (B), OCT4, NANOG, CTCF, H3K4me3, H3K4me3 ChIP-seq peaks (C), H3R26Cit peaks (D), SMARCAD1 peaks (E), and the overlaps of H3R26Cit and SMARCAD1 peaks (F). All peaks were defined by ChIP-seq in ES cells. (G) A genome browser view of H3R26Cit, SMARCAD1, H3K9me3 ChIP-seq in ES cells, H3K9me3 in Smarcad1 KD cells, H3K9me3 in Cl+ ES cells, and IgG ChIP-seq and MNase-seq in ES cells.

