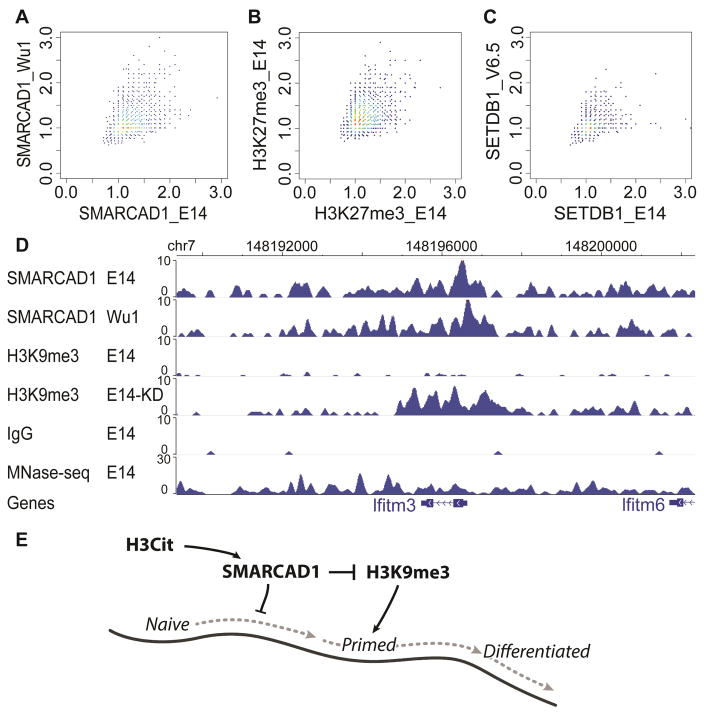
Figure 6. Variation of SMARCAD1 ChIP-seq in male (E14) and female (Wu1) ES cells.
The mappable portion of the genome (mm9) was separated into a total of 4,854,116 non-overlapping 500-bp bins. A subset of 5,000 bins were drawn at random for plotting (A–C). (A) Scatter plot of the ratio of SMARCAD1 and IgG ChIP-seq reads in 500-bp bins in E14 (x axis) and in Wu1 (y axis). (B) Scatter plot between two biological replicates (GSM1199184 on y axis, GSM2111307 on x axis). Each dot is a ratio of H3K27me3 and IgG ChIP-seq reads in a 500 bp bin. (C) Scatter plot of ratio between ESET ChIP-seq and IgG ChIP-seq reads in E14 (GSM440256) (x axis) and V6.5 ES cells (GSM459273) (y axis). (D) Genome browser view of SMARCAD1 ChIP-seq in E14 and Wu1 cells, and H3K9me3 in E14 and in Smarcad1 KD cells (E14-KD). MNase-seq: sequencing of input DNA fragmented by MNase. (E) A speculated model for the role of SMARCAD1 in regulating the naïve pluripotent state. Naïve pluripotent, primed pluripotent, and differentiated cells are situated on an epigenetic landscape (dark curve). In this model, SMARCAD1 contributes to keep cells at the highest position on the epigenetic landscape, by translating H3Cit into an inhibitory signal of H3K9me3.

