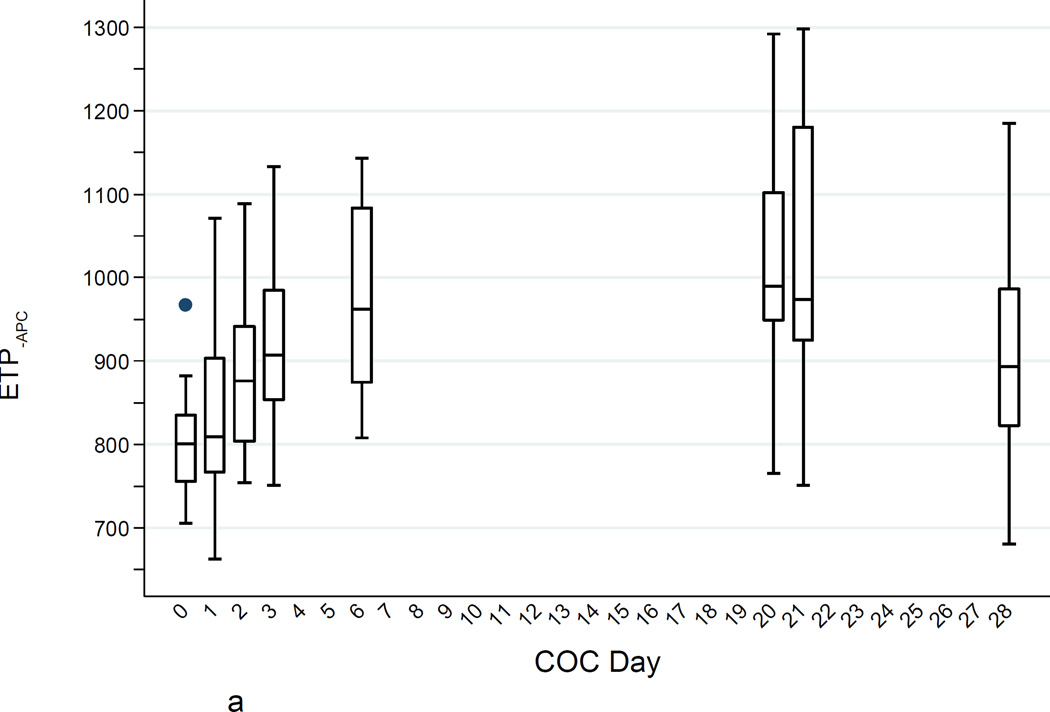
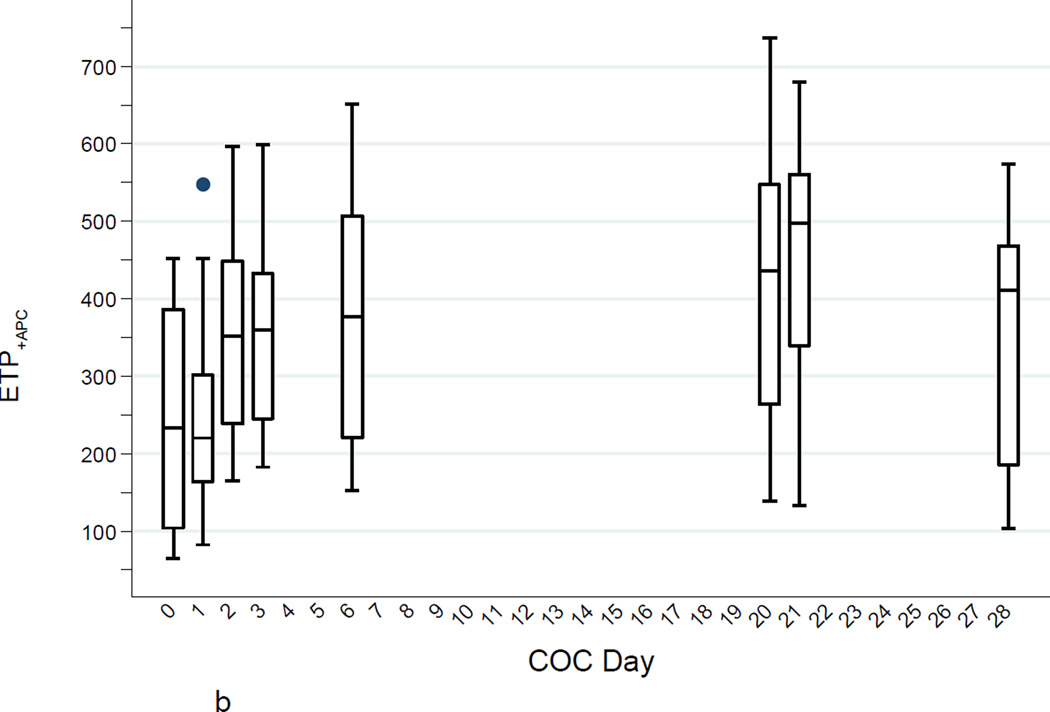
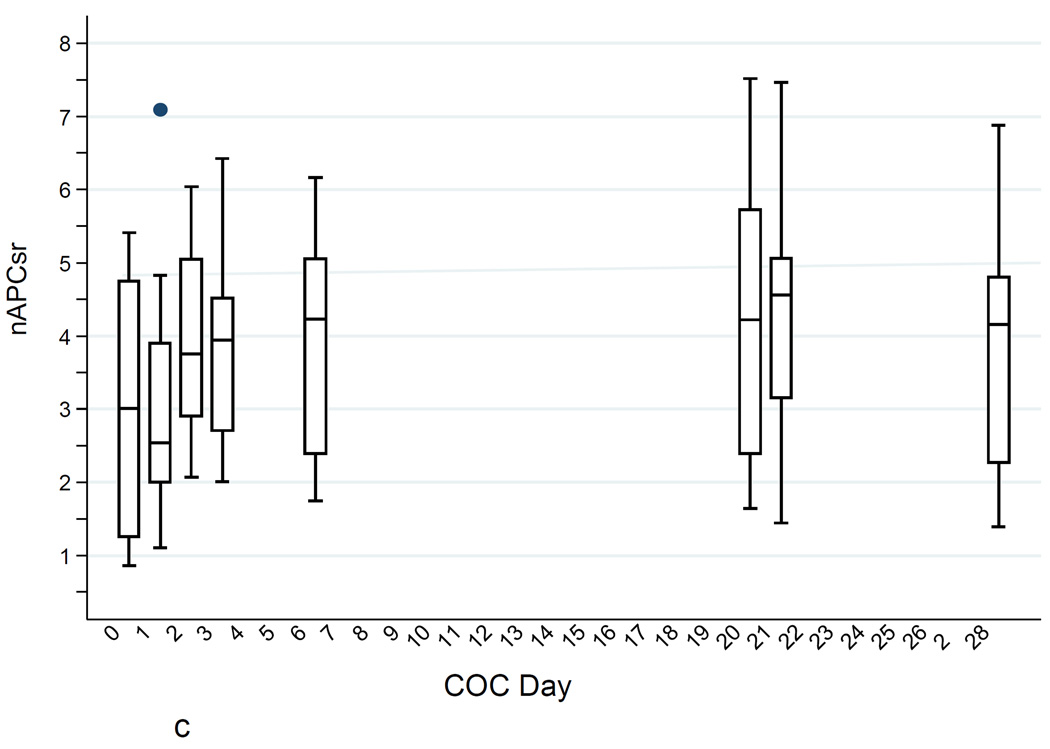
Fig. 1.
a. ETP−APC (nM·min) levels during the COC cycle. Boxes show medians and interquartile ranges (IQR); lower whiskers denote the smallest values ≥ (25th percentile − 1.5 × IQR); upper whiskers denote the largest values ≤ (75th percentile + 1.5 × IQR); and individual points denote values outside the whiskers.
b. ETP+APC (nM·min) levels (high TF) during the COC cycle (boxes as in Fig. 1a).
c. ETPnAPCsr levels (high TF) during the COC cycle (boxes as in Fig. 1a).


