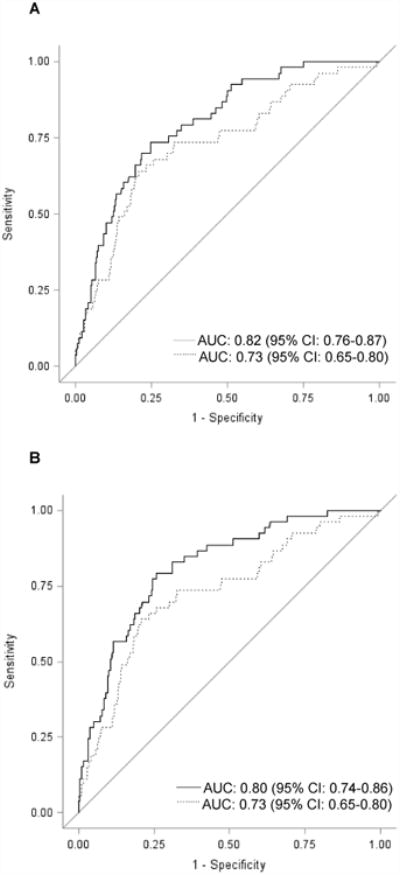
Figure 2. Receiver Operating Characteristic Curves for Models to Predict Radiographic Knee OA Defined as KL≥2.

The figure shows receiver operating characteristic (ROC) curves for two prediction models (to predict KL≥2). In each figure, the dotted line represents the model including age, gender, overweight, obesity, hand OA, knee injury, knee surgery, LIFT, SQUAT, and WOMAC Pain. The solid line in Figure 2A represents the model including age, gender, overweight, obesity, hand OA, knee injury, knee surgery, LIFT, SQUAT, WOMAC Pain + number of subregions with cartilage damage. The solid line in Figure 2B represents the model including age, gender, overweight, obesity, hand OA, knee injury, knee surgery, LIFT, SQUAT, WOMAC Pain + sum of lesion types. (n=841 persons, 1 knee/person) (AUC=area under the curve; CI=confidence interval)
