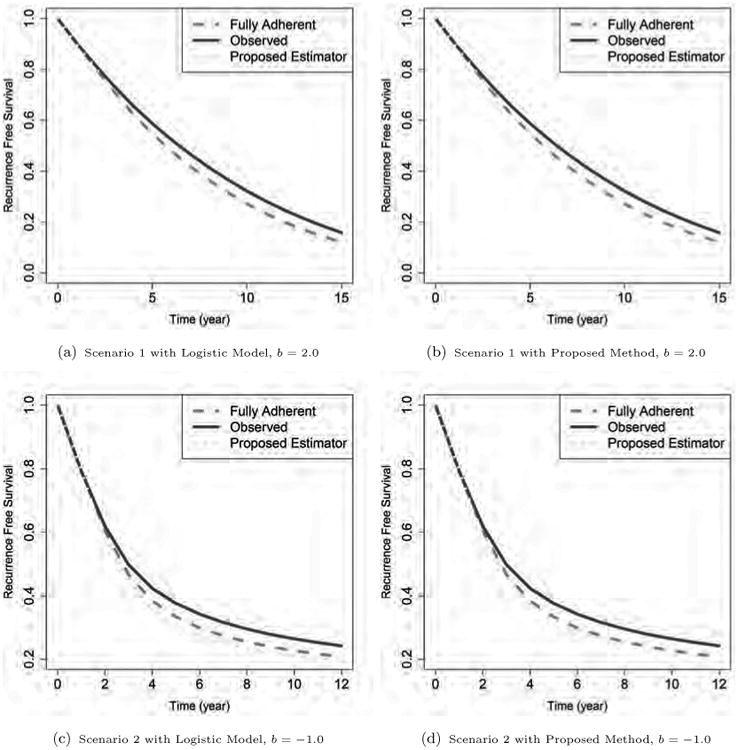
Figure 1.

The estimated survival curves for different simulation schemes. The regime specific true curves (obtained from the counterfactual fully adherent cohorts) are shown in dashed lines. The solid lines are unweighted estimates from the observed data (obtained by censoring subjects when they are no longer adherent with given regimes), and the dotted lines are for the proposed weighted estimates. The upper panels are from regime b = 2.0 in Scenario 1, and the lower panels are from regime b = -1.0 in Scenario 2. The two panels on the left show estimation from the pooled logistic method, while the panels on the right show results from the proposed Random Forest based method. All curves are obtained by averaging over 500 simulations.
