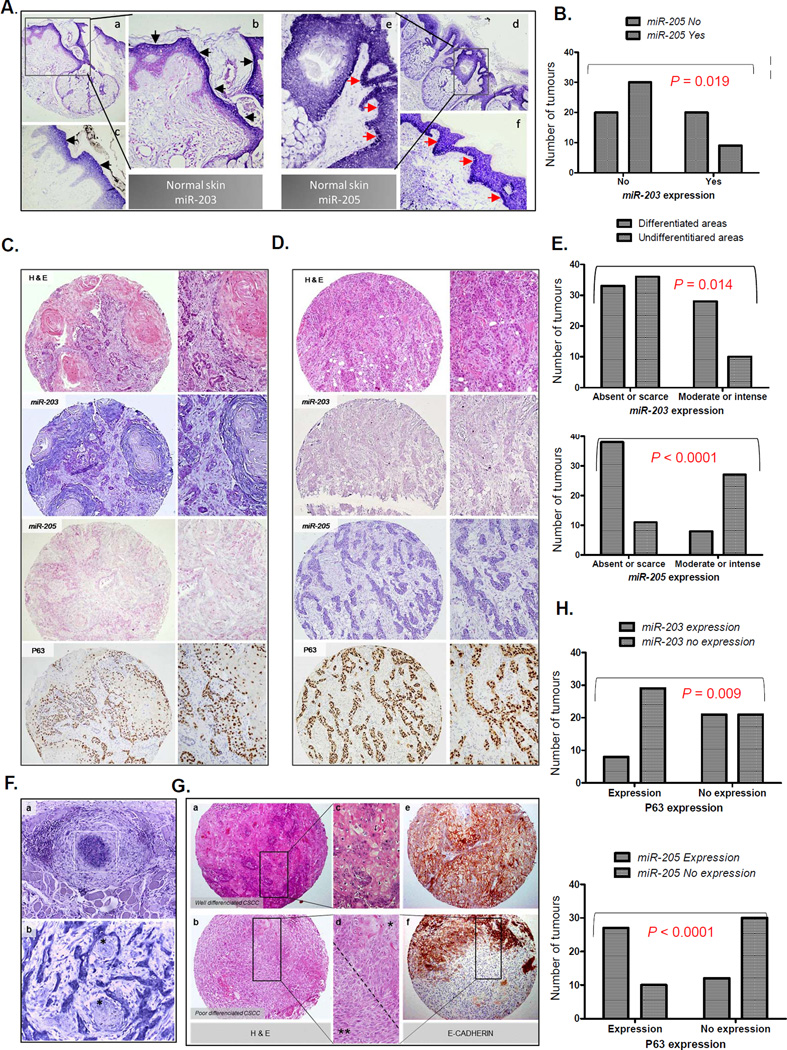
Figure 2. Expression of miR-203 and miR-205 in human CSCC.
A) Expression of miR-203 and miR-205 in normal skin as determined by in situ hybridization (ISH). Markedly, miR-203 is expressed in the epidermal upper layers of the epidermis (a, b (100x) and c (400x), black arrowheads), whereas miR-205 is expressed in the basal and immediately suprabasal layers of the epithelia (d, e (100x) and f (400x), red arrowheads). B) Mutually exclusive expression of miR-205 and miR-203 in CSCC. Pearson’s Chi-square test. C) Example of a well-differentiated CSCC. The haematoxylin and eosin (H&E) section shows intense keratinization in the central zones of the tumoural lobules (100x and 400x). The pictures show miR-203 and miR205 expression by ISH and P63 expression by immunohistochemistry (IQ) from the same tumour, as indicated in the pictures. MiR-203 is highly expressed, whereas miR-205 and P63 were poorly expressed. D) Example of a poorly-differentiated CSCC. The H&E section shows strands of epithelial cells without keratinization (100x). MiR-205 and P63 were highly expressed, whereas miR-203 is poorly expressed. In C and D, pictures on the right correspond to more augmented details (400x) from the ones on the left (100x). E) Quantification of miR-203 and miR-205 expression in differentiated and undifferentiated areas of CSCC. Pearson’s Chi-square test. F) Upper figure: Strong miR-205 expression in CSCC cells that are forming an intravascular tumoural thrombus (a, and white square) (400x). Lower figure: High miR-205 expression present in tumoral cells in the front of invasion with perineural infiltration (b) (400x). Nerves are indicated by an asterisk (ӿ). G) H&E staining (a,b,c,d) and E-CADHERIN expression (e, f) (100x) done by immunohistochemistry in a well- (a,d,e) and poorly-differentiated (b,d,f) CSCCs. There is strong E-CADHERIN expression in the epithelial cells of the well-differentiated CSCC (e) (100x). In d (400x), there are typical epithelial cells in the upper portion of the picture (ӿ) that correspond to zones with strong staining to E-CADHERIN (f, upper portion of the spot), and tumoral spindle cells in the lower one (ӿ ӿ) that correspond to zones without expression of E-CADHERIN (f, lower portion of the spot). This zone illustrates the tumour heterogeneity and the epithelial to mesenchymal transition process. H) Upper figure: miR-203 expression is significantly absent when P63 is present. Lower figure: miR-205 and P63 coexpressed in the same tumours in a statistically significant manner. P values were obtained by the Pearson’s Chi-square test.

