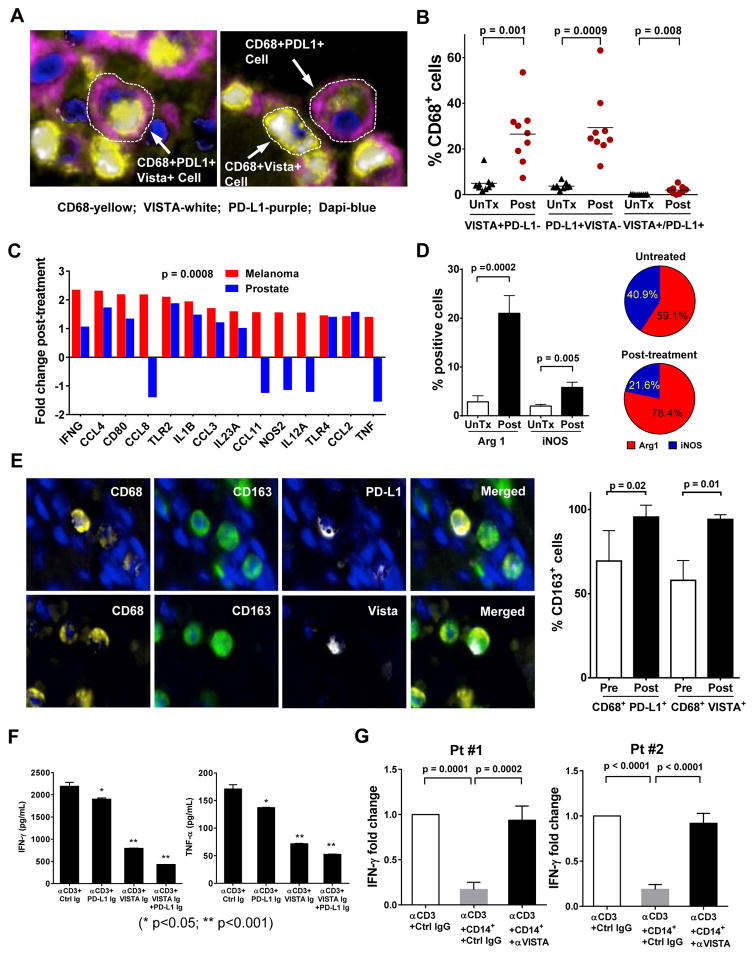
Figure 2. PD-L1+ and VISTA+ macrophages (CD68+) manifest an M2-phenotype and suppress T cell function.
(a) Representative photographs from immunofluorescence (IF) multiplex staining of PD-L1 (purple), VISTA (white), CD68 (yellow), and tumor nuclei (blue) in post-treatment prostate tumors. (b) Frequency of PD-L1 and VISTA expression on CD68+ macrophages from stage-matched untreated (UnTx; N=9) and post-treatment prostate tumors (N=9); (c) Fold induction of M1-like genes in post-treatment prostate tumors (N=6) and post-treatment melanomas (N=20) as compared to respective untreated samples. (d) Quantitative IHC analysis of Arg1+ cells in untreated (N=10) and post-treatment (N=15) prostate tumors (left panel), as well as ratio of Arg1/iNOS in untreated and post-treatment tumors (right panel). (e) Representative photographs from multiplex IF staining of tumor (blue), CD68 (yellow) and CD163 (green) with PD-L1 (white) or VISTA (white) in post-treatment prostate tumors (upper panel), as well as quantitative analysis of CD163 expression by CD68+PD-L1+ or CD68+VISTA+ cells from pre- (N=5) and post-treatment (N=5) prostate tumors (lower panel). (f) IFN-γ (left panel) and TNF-α (right panel) production by patients’ (N=7) peripheral T cells after CD3 stimulation in the presence of plate-bound control Ig (Ctrl Ig), PD-L1-Ig, VISTA-Ig protein or a combination of both. (g) IFN-γ production by patient’s peripheral T cells after CD3 stimulation without co-culture of monocytes or in the presence of either untreated monocytes or monocytes pretreated with anti-VISTA antibody. Experiments were performed in triplicates.

