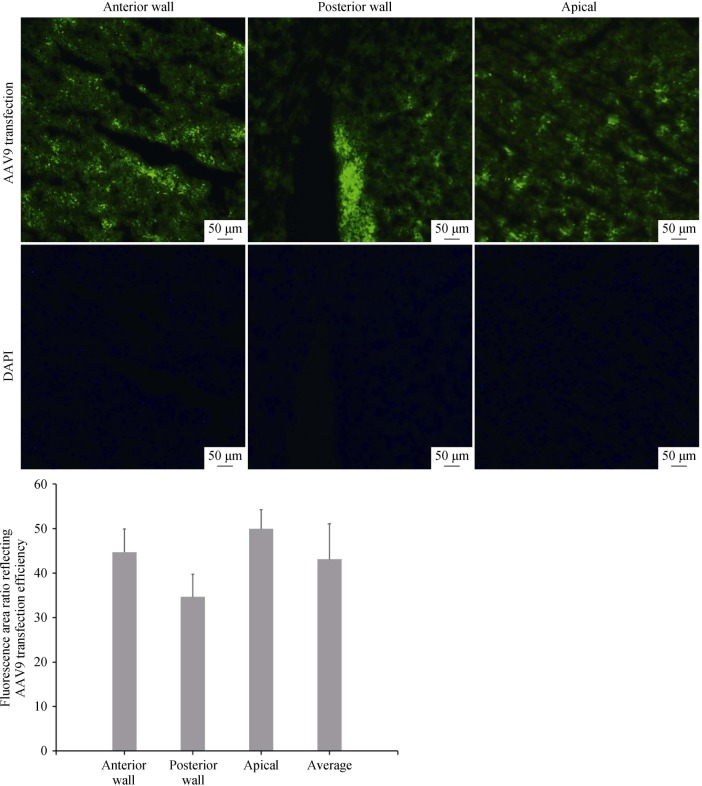
Figure 1. Fluorescence area ratio reflecting the AAV9 transduction efficiency in different locations of the ventricle of myocardial tissues under a fluorescence microscope.
Anterior wall: 44.71% ± 5.23%, posterior wall: 34.64% ± 5.07%, apical: 49.94% ± 4.3%, average: 43.09% ± 7.98%. All scale bars represent 50 µm (magnification 100 ×).

