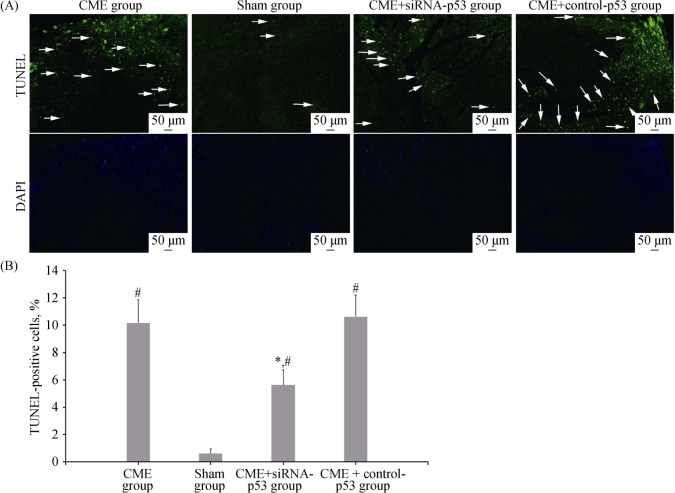
Figure 2. TUNEL staining of myocardial tissues.
(A): Apoptotic nuclei emit green fluorescence; the arrows indicate apoptotic cardiomyocyte nuclei; (B): TUNEL-positive cell percent. *P < 0.05 compared to the CME group; #P < 0.05 compared to the sham group. All scale bars represent 50 µm (magnification 100 ×). CME: coronary micro-embolization.

