
FIGURE 7.
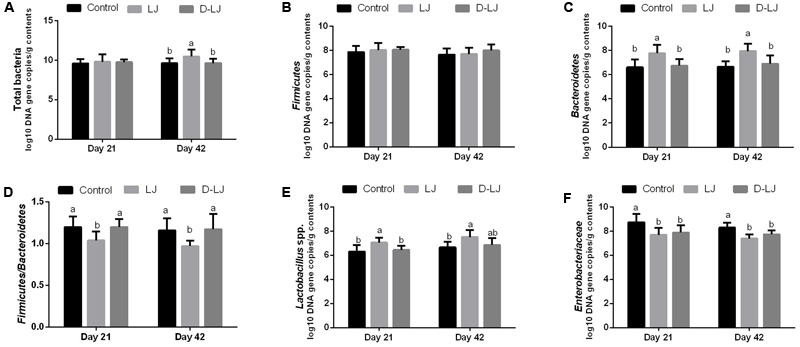
Microbial populations in the ileum as quantified by quantitative PCR. Bars with different letters are significantly different on the basis of Duncan’s multiple range tests (P < 0.05). Data are presented as mean ± standard deviation (six replicates of one chick per cage). (A–C,E–F) Log10 DNA gene copies of total bacteria, Firmicutes, Bacteroidetes, Lactobacillus spp., and Enterobacteriaceae. (D) Firmicutes/Bacteroidetes ratio.