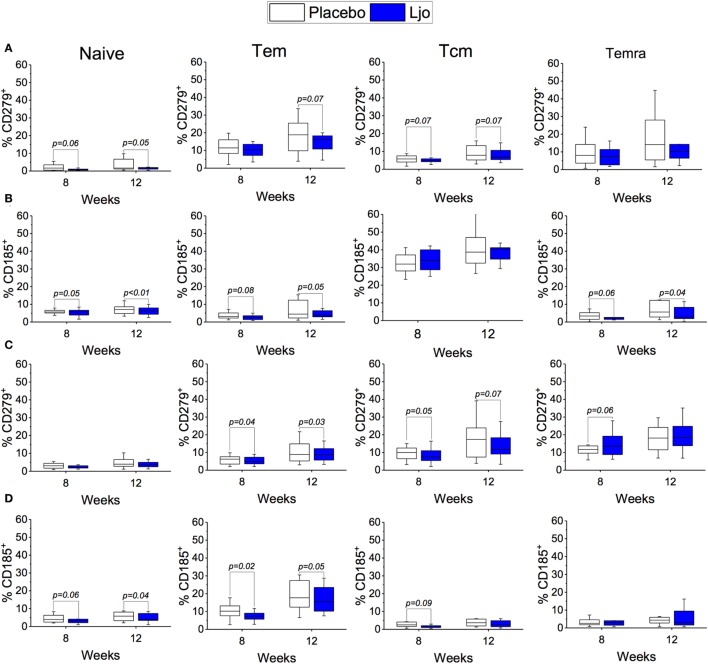
Figure 6.
Expression of CD185+ and CD279+ on T cells subset. Expression of CD279+ (A) or CD185+ (B) on Naïve, Tem, Tcm, and Temra CD4+ T cells. Expression of CD279+ (C) or CD185+ (D) on Naïve, Tem, Tcm, and Temra CD8+ T cells. The number of cells in each population was evaluated for the placebo (white bars) and the L. johnsonii N6.2 (Ljo, blue bars) group at 8 and 12 weeks. The concentration of cells shown has been normalized to the concentration found at time 0 for each subject.

