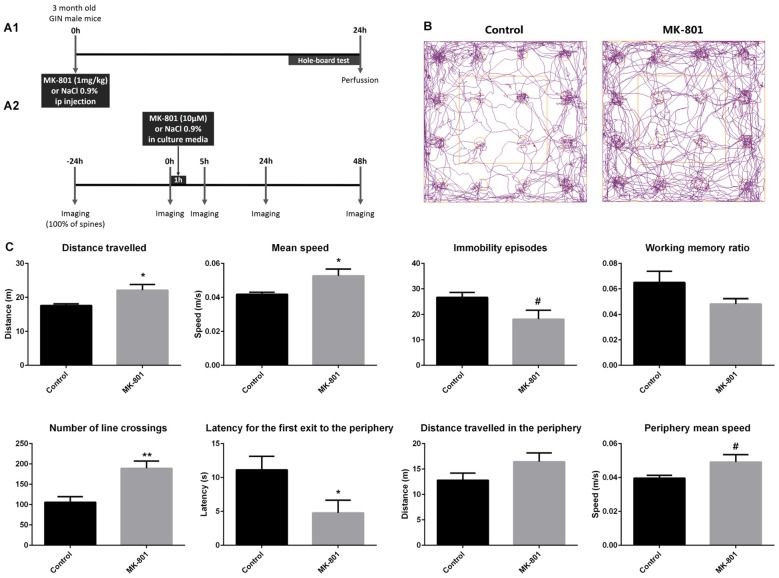
Figure 1.
(A1) Experimental design of the in vivo experiment. (A2) Experimental design of the real-time in vitro experiment. (B,C) Hole-board behavioral test. (B) Representative tracking-plots of NaCl-treated animals (control) and MK-801-treated animals (MK-801). (C) Graphs representing the changes observed in the behavioral parameters that were analyzed (all graphs represent mean + SEM., *p < 0.05, **p < 0.01, #0.05 < p < 0.1).

